 Friends of Gualala River Protecting the Gualala River watershed and the species living within it
July 19, 2004
Allen Robertson, Deputy Chief
California Department ofForestry and Fire Protection
P.O. Box 944246
Sacramento, CA 94244-2460
Re: NegativeDeclaration for Sleepy Hollow Timberland Conversion Permit #531
Associated THP 1-04-059 SON
CDF File 1-04-059
Dear Deputy Chief Robertson:
I would like to offer my comments on the proposed NegativeDeclaration for the Sleepy Hollow Timberland Conversion and associated THP1-04-059 SON. I was the Hydrologist for the Mendocino County Water Agency(MCWA) from May 1989 to November 1994. The Mendocino County Board ofSupervisors appointed me as their representative on pre-harvest inspections forTHPs with the potential to impact public water systems. As the MCWAHydrologist, I also reviewed Proof-of-Water pump tests for the Town ofMendocino. I also routinely reviewed CEQA documents for projects before thePlanning Commission. I have a Masters in Physical Science specializing inHydrology from Chico State University. Since 1994 I have been a consulting Hydrologist.I have also taught Hydrology at California State University, Monterey Bay.
The proposed Sleepy Hollow Timberland conversion islocated in Sonoma County, approximately one-third mile northeast of Annapolis.The proposal is to replace 25 acres of coniferous forest with 20 acres ofvineyards, 3 acres for vineyard roads and 2 acres for buildings. The project ison the southeast end of Brushy Ridge. The proposed conversion drains to LittleCreek and then to Buckeye Creek and finally to the South Fork of the GualalaRiver. Lower Little Creek supports steelhead and is therefore a Class I stream.Steelhead were listed as threatened, in the Northern California ESU, on June 7,2000. The Gualala River is listed as impaired by sediment and temperature. As aresult, the THP associated with the Sleepy Hollow Timberland Conversion mustfollow the Forest Practice Rule 916.9 Protection and Restoration inWatersheds with Threatened or Impaired Values.
The 25 acres that are proposed to be clearcut under theTimberland Conversion permit
Based upon my review of
· theMitigated Negative Declaration;
· theTHP including the Erosion Control Plan and plan revision by the RPF;
· theRegional Water Quality Control Board staff Pre-harvest Inspection Report
and other documents in the file, I find that the proposedMitigated Negative Declaration for the Sleepy Hollow Timberland conversion isinappropriate because it is based on unsupported statements and questionabledata and ignores findings from Caspar Creek and nearby projects. In addition,the cumulative effect analysis is very weak and does not support the conclusionof no cumulative impacts. Therefore, an Environmental Impact Report (EIR)should be required for this project.
Incomplete Project Description
The Executive Summary of the Initial Study for the SleepyHollow Timberland Conversion Mitigated Negative Declaration states that theslopes range from 0-18% in the area of the conversion (page 3 0f 47). This doesnot appear to reflect the slopes indicated on the topographic maps. The portionof vineyard Block-1 (see page 60 of the THP) between the 640’ and 680’ contourlines (roughly 2 acres) appears to have slopes ranging from 20% to 35%. Theportion of vineyard Block-2 between the 680’ and 720’ contour lines (roughlyone acre) appears to slopes of about 25% with one location having a slope ofabout 40%. Therefore, it is possible that terracing may be required for aportion of vineyard Block-2, according to the guidelines outlined on page 42 ofthe THP.
According to page 35 of the THP, the Sonoma County SoilSurvey the Goldridge soils on Brushy Ridge are in the 15% to 30% slope class.This appears to support the presence of slopes greater than 18% suggested bythe topographic map.
Scott Gergus, North Coast Regional Water Quality ControlBoard (RWQCB), on page 6 of his Pre-harvest Inspection (PHI) Report states:
Map Point #4 – In Vineyard Block #1, the southeastern-mostClass III watercourse located below the convergence of two Class IIIwatercourses contained isolated pools. Hillslopes in this area were measured tobe 45%. Consideration should be given to reclassifying this watercourse as aClass II. During the inspection the RPF moved the watercourse protection zoneflagging away from the watercourse to the break-in-slope. This distance is inexcess of 75 feet and provides for Class II watercourse protection zone forslopes up to 50% and appeared to be acceptable during the inspection.
So, it appears that there are slopes requiring terracingin Vineyard Block-1 as well as in Block-2. Failure to terrace the areas withslopes greater than 40% may result in significant slope failures. These areasshould be field checked and an appropriate terrace should be designed, ifneeded. Terracing of the steeper areas may also require a Sonoma County GradingPermit. The areas with steeper slopes should be noted on the THP maps and aseparate Erosion Hazard Rating should be calculated for them. The source of thedata used to calculate the moderate Erosion Hazard Rating should be given.
I recalculated the Erosion Hazard Rating for the areaswith slopes of 45% or greater. No change was made to the Soil Texture Rating of22. The Slope Rating was set equal to 15. The Protective Vegetative Cover afterDisturbance was set to 15. The two year, one-hour rainfall was assumed to beequal to 1.76” per hour (NOAA 1973, as quoted in O’Conner, March 2002) so itreceived a rating of 15. The total Sum of Factors for the steeper areas was 67(=22+15+15+15) which results in the steeper areas receiving a High Erosion HazardRating.
Mr. Gergus’ PHI report indicates that the RPF agreed toupgrade a Class III watercourse to a Class II watercourse (see above quote).The RPF moved the WLPZ flagging in the field, but has not updated thedesignation on the maps on pages 18 and 19 of the THP. The maps in the THP arean important part of the Project Description and must be changed.
The THP (page 12) claims that there are no Class I, ClassII or Class III watercourses within the plan area. This is not the case. TheClass II and Class II watercourses have been give the standard WLPZ protection.The THP states that the
The adjacent Class III watercourses have been give a 50 footriparian buffer to protect the vegetation cover and habitat. To the fullestextent possible and with consideration to topography, lean of trees, landings,utility poles, local obstructions and safety factors, trees shall be felled tolead in a direction away from class III watercourses. An effort will be made toretain surface cover and to protect vegetation adjacent to watercourse fromexcessive disturbance, providing wildlife habitat and aiding in the filtrationof organic and inorganic materials. Temporary crossings and any soil depositedduring timber operations in a class III watercourse shall be removed prior tothe winter period. Debris deposited in a class III watercourse during timberoperations shall be removed or stabilized prior to October 15. Except atdesignated crossings flagged by the RPF prior to operations (if any are found),heavy equipment shall not enter (ELZ) within 50 feet of the class IIIwatercourses.
This statement shows that the Class III watercourses weregiven a standard WLPZ and treated as part of the plan. In addition, the PHIreport from the North Coast Regional Water Quality Control Board staffdemonstrates that the Class III watercourses were flagged with WLPZ tape andthat one Class III watercourse was upgraded to a Class II. If the watercourseson the Martin property were truly not part of the plan there would be no reasonto flag them with WLZP tape.
Claiming that the Class II and Class III watercourses thatare surrounded by the Timberland Conversion area are not part of the plan isfallacious reasoning. This reasoning is equivalent to claiming that providingthe WLPZ protection to a watercourse, required by the Forest Practice Act(FPA), removes it from the THP. This is clearly not the intent of the FPA.
Claiming that there are no watercourses within theboundaries of the THP and Timberland Conversion area is contrary to the factthat there are Class II and Class III watercourses within the THP/Conversionarea and that they have been provided the protections of a standard WLPZ. Theclaim that there are no watercourses within the THP/Conversion area isincorrect and renders the Project Description incomplete and misleading.
Mr. Gergus (RWQCB) also recommended (p. 6) rocking a ClassIII crossing of an existing but unused road (overgrown). He notes that, “Runoffacross the road has eroded the fillslope and created a nick point”. He isconcerned that, “Additional runoff from the proposed vineyard might reactivatethe erosion of the fillslope and nick point”. Mr. Gergus’ third recommendationis, “To prevent future erosion, the nick point and fillslope need to bereinforced with riprap”. The RPF submitted a revised page 13 to the THP addingArea C to Item 27 concerning site-specific practices proposed in-lieu ofstandard WLPZ practices and a revised page 19 which is a map showing thelocation of areas A, B and C. The narrative for Area C on the revised page 13states that the nick point will be rip-rapped using 6” rock. No mention ofrocking the fillslope is made in the revision. It is essential that therip-rapping the fillslope be specifically mentioned in the narrative for Area C.
Overestimate of Average Rainfall
Page 36 of the THP, the Erosion Control Plan (ECP) datedOctober 21, 2003, states that, “Per Plate B3 in the Sonoma County Water AgencyFlood Control Manual, this ridge crest location at about 800 feet elevationwith an estimated average annual rainfall of about 70” (5.83)”.
The 70 inch estimate for the mean annual precipitationappears to be a significant over-estimate of the mean annual precipitation atthe site of the Sleepy Hollow Timberland Conversion. A USGS map of mean annualprecipitation is shown in Figure 1. The USGS map shows that the mean annualprecipitation is about 55” and is certainly less than 60″. The USGS hasstringent quality control guidelines and a through peer-review process. It isunknown what level of quality control and peer-review the Sonoma County WaterAgency maps were subjected to. It seems prudent to make estimates ofwater-availability for irrigation based on the more conservative value of 55 to60 inches.
As a check on the reliability of the USGS rainfall map Iused rainfall data collected near the project site. The Smith family hascollected rainfall data for 18 years on Annapolis Road, approximately 2.3 miles from the Sleepy Hollow property. Figure 3and Table 1 show the data collected near Annapolis and the Fort Ross data. Ideveloped a linear regression model to predict the Smith rainfall data giventhe Fort Ross rainfall data. The Fort Ross rainfall data explained 97% of thevariability in the Smith family rainfall record. I used this model to extendthe Smith rainfall record to the same 98-year period (1906-2003) as the FortRoss station. The extended Annapolis rainfall record is shown in Figure 4. Themean annual precipitation of the extended rainfall record for Annapolis is59.55″.
Table 2 shows Annapolis rainfall year (July 1 – June 30)data from the Independent Coast Observer(ICO), a newspaper printed inGualala. The 28 years of record has an average of 59.16 inches. So, the USGSprecipitation map, the Smith family data and the data from the ICO agree thatthe Annapolis annual average precipitation is just over 59 inches.
The summary statistics for the Fort Ross data and for theextended Annapolis area rainfall record are shown in Table 3 along with theestimated annual rainfall for various levels of exceedence probability. A 95%exceedence probability rainfall of 34.9 inches means that in 95% of years therainfall would be expected to be greater than 34.9 inches and in 5% of theyears the rainfall would be less than or equal to 34.9 inches. The less than60” estimate from the USGS average annual precipitation map and the extendedSmith rainfall record of 59.55” show good agreement. Therefore, it appears thatthe estimate of 70” for the average annual precipitation used in the ECP overestimatesthe Annapolis average annual precipitation of 59.55” estimated from localsources and confirmed by the USGS precipitation map by 17.5%. Therefore,conclusions based on the over-estimated annual average precipitation areincorrect and misleading.
Overestimate of Average Year Runoff
Figure 2 shows a portion of the map of mean annual runoffprepared by the USGS in 1974. The map shows that the mean annual runoff for theAnnapolis area is about 24″ per year. So, the annual averagerunoff/rainfall ratio for the Annapolis area is 24”/59.5” = 0.403 or 40.3%.This estimate of the average annual runoff/rainfall ratio for the Annapolis(40.3%) agrees very closely with the ratio calculated from the Caspar Creekdata for the 1990-1995 water years. According to Ziemmer (1997) the CasparCreek average precipitation for 1990-1995 was 1188.3 mm and that the runoff forthe North Fork of Caspar Creek was 503 mm and that the runoff for the SouthFork was 461 mm. So, the runoff/rainfall ratio for the North Fork was 503mm/1188.3mm= 0.423 or 42.3%. The runoff/rainfall ratio for the South Fork was461mm/1188.3mm = 0.388 or 38.8%. Therefore, the use of a 50% runoff/rainfallratio in the ECP for average annual runoff calculations would appear to overestimate runoff from the proposed timberland conversion by 25%.
Inadequacy of the Existing Well
The ECP estimates that once the vines are established, inapproximately 2 years, that they will require only 20 gal/vine/season, which isequivalent to 1.35 acre-feet of water. However, the ECP does not estimate theamount of water required to establish the vines during the initial two yearperiod. The calculation below shows that the water required to establish thevines is significantly more than the amount required to maintain them.
While the ECP does not present the volume of waterrequired per year to establish the vines it does provide the followinginformation about the water required during the first two years (page 38 ofTHP):
· “…atypical planting density of about 1,100 vines per acre”
· “…weekly watering for the first year or two of vine establishment”
· “…a typical design volume is on the order of 5 gallons/vine/week, …”
· “…overa 4-month irrigation season.”
In discussing the water volume required for the establishedvines, the ECP claims that,
The volume can be provided by an existing well tested at 10gpm, if operated 8 hours/day for 23 days each month over a 4-month irrigationseason.
The following calculation shows that the existing well cannot produce enough water to establishthe 20 acres of vineyards proposed by the Sleepy Hollow Timberland Conversionapplication.
A pump producing 10 gpm will produce 14,400 gallons perday, pumping non-stop for 24-hours per day. Each vine requires 5 gallons perweekly watering, so a total of 2,880 vines can be watered per day. At a densityof 1,100 vines per acre, a total of 2.62 acres can be watered per day. The 20acres of vineyard will take 7.64 days to water, which is slightly longer than aweek. Therefore, the projected output of the well appears to be insufficient towater the proposed 20 acre vineyard on a weekly schedule. The abovecalculations are summarized below.
|
vines per acre
|
Pump hours per day
|
Pump minutes per day
|
Pump gallons per minute
|
Pump gallons per day
|
gallons per vine
|
Vines per day
|
Acres per day
|
Days to Water 20 Acres
|
|
1,100
|
24
|
1440
|
10
|
14,400
|
5
|
2,880
|
2.62
|
7.64
|
By reducing the planted area to no more than 18.3 acres, awell that actually produced 10 gpm could produce exactly enough water to justmaintain the weekly watering schedule required to establish the vines. However,if the pump develops mechanical problems during the first two years of vineestablishment, there may not be enough water to establish the vines.Furthermore, during sustained hot weather irrigation would be required morefrequently during the first two years.
The minimum total volume required during the first twoyears of vine establishment if 4.05 acre-feet as shown in the followingcalculation.
|
vines per acre
|
gallons per vine
|
acres
|
weekly water gallons
|
Weekly Water Cubic Feet
|
Weekly Water acre Feet
|
Number of Weeks
|
Required Irrigation per season acre feet
|
|
1,100
|
5
|
20
|
110,000
|
14,705
|
0.34
|
12
|
4.05
|
Pumping 24-hours per day for 12 weeks will produce a totalof 3.71 acre-feet or 0.34 acre-feet lessthan the total volume of required to establish 20 acres of new vines.
The above calculations give estimates of the minimumamount of water required to establish vines on 20 acres. The calculationsassume near normal summer conditions and rainfall during the previous winter.Additional water may be required during extended hot weather. The abovecalculations also do not account for water for frost protection. The site forthe proposed vineyard is on a ridge, so it will not be subject to the effects ofcold air sinking into valleys. However, even ridge-top sites can experiencebelow freezing temperatures in Sonoma County. Occasionally, artic air massesmove into the area and cause temperatures to drop well below freezing. It isexpected that the total number of days requiring frost protection on a ridgewill be less than the number of days required for a valley site.
Failure to provide sufficient water for frost protectionmay result in the loss of the vineyard. The amount of water required for frostprotection is significantly greater than can be supplied by a well pumping at10 gpm since all of the vines will have to be watered simultaneously.Therefore, CDF should require that the applicant estimate the amount of waterrequired per night during the frost season and explain how it will be supplied.
The above discussion demonstrates that the existing wellis inadequate to establish 20 acres of new vines. The above analysis does notanswer the crucial question of whether the existing well can be pumped at asustained rate of 10 gpm for 12 weeks. Another question that needs to beaddressed is whether the aquifer that supplies the existing well is largeenough to supply the total volume of water needed to establish the new vinesand to maintain the vines once they are established.
The ECP (p 38 of theTHP) states that:
For a typical plantingdensity of about 1,100 vines/acre, the seasonal water demand at 20gal/vine/season over 20 acres is about 1.3 acre-feet. This is about equal tothe seasonal evapotranspiration from an acre of forest, as noted above.The volume can be provided by an existing well tested at 10 gpm, if operated 8hours/day for 23 days/month over a 4-month irrigation season. To facilitateirrigation scheduling, one or more moderately sized storage tanks will be usedand the vineyard will be divided into blocks of about 2 acres.
The RWQCB PHI report notes that,
A 10-gallon per minute well will be used to irrigate the25-acre vineyard. The RPF indicated that a four-hour pump test had been conducted,with a significant draw down,. Normally, pump tests are conducted for 72 hoursand the draw down is not significant, especially given the low rate ofproduction. It is not clear why the pump test for the proposed irrigation wellwas only conducted for 4 hours, but a pump test for this short duration may notbe adequate to ensure that the water supply and/or the proposed well areadequate for the intended water use on this site.
I am informed that the RPF passing official well report aroundthe table at the CDF second review of the THP/Conversion. A copy was promisedto be added to the THP/TCP file by the RPF but the owner objected. However, Ihave heard that the owner told an adjacent neighbor, who was at second reviewand recorded the well information, that the well produced 7 gpm, not 10 gpm. Iam told that the official well report that was passed around at the SecondReview meeting showed that the depth of the well was 180 feet; that the staticwater level prior to the test was 32 feet and that the drillers performed atwo-hour test at 10 gpm and measured a 175 feet of drawdown. The MitigatedNegative Declaration cites the well being 250 feet deep.
The well information that was reportedly revealed at theSecond Review meeting and the neighbor’s claim that the owner said that thewell yield was 7 gpm supports the above analysis that the well is inadequate towater the proposed 20 acres of vineyard, especially during the first two yearswhen the vines are being established.
Much more information is required to determine if theexisting well can supply the proposed vineyard, especially during theestablishment of the vines. The RPF told Mr. Gergus that a four hour pump testhad been conducted and that significant draw down occurred. Specifics about thedraw down observed during the test and at the end of the test, depth of well,level of the pump, size of the well casing and discharge rate were not given toMr. Gergus. Mr. Gergus, RWQCB, has expressed concern that
…a pump test for this short duration may not be adequate toensure that the water supply and/or the proposed well are adequate for theintended water use on this site.
FPA Rule 1105.2, quoted below, requires that adequatequality and quantity of water be available to ensure the economic viability ofthe project.
1105.2 Director’s Determination
The Director shall determine the applicant’s bona fideintention to convert in light of the present and predicted economic ability ofthe applicant to carry out the proposed conversion; the environmentalfeasibility of the conversion, including, but not limited to, suitability ofsoils, slope, aspect, quality and quantity of water, and micro-climate;adequacy and feasibility of possible measures for mitigation of significationadverse environmental impacts; and other foreseeable factors necessary forsuccessful conversion to the proposed land use.
It is also in the applicant’s interest to verify that thewell will be able to supply the water needed to establish and maintain theproposed vineyard. For an unconfined aquifer, such as the Ohlson Formation, awell test should be conducted at a constant discharge rate for a minimum of 72hours. A properly conducted 72-hour constant-discharge pump test will be ablediscern if the existing well can supply the water needed to establish andmaintain the vineyard.
Therefore, CDF should require that a 72-hourconstant-discharge pump test be conducted by a qualified hydrogeologistaccording to the standards set forth on pages 535 to 579 of Groundwater andWells by Fletcher G. Driscoll, SecondEdition, 1986. The 72-hour constant-discharge well test should be conducted inlate August or early September prior to any rainfall. The groundwater level inthe well should be monitored prior to the 72-hour pump test.
The 72-hour constant-discharge well test is necessary todetermine if the existing well can produce the 10 gallon per minute dischargerate that the ECP claims would be sufficient to irrigate the twenty acrevineyard. However, the 10 gpm claimed output of the well does not appear to besufficient to irrigate the vineyard.
The above discussion shows that it is crucial to prove, bya 72-hour constant-discharge well test that the existing well can produce 10gpm over a sustained period of 12 weeks with non-stop pumping. In addition todemonstrating that the well can produce the claimed 10 gpm during a sustainedperiod of pumping, it is also critical that estimates of the aquifer (OhlsonRanch Formation) characteristics be determined so that estimates of thesustained yield of the aquifer can be made. This is particularly importantsince the Ohlson Ranch Formation is limited in extent.
The assessment of the aquifer characteristics should alsoinclude an analysis of the affect of pumping the well on the spring and theClass II watercourse in the southeastern corner of the plan.
Dry Season Flow
The Caspar Creek watershed studies suggest that theremoval of trees increases summer streamflow because less moisture is removedfrom soil moisture storage by the replacement vegetation than was used by thetrees. In general this is true but in itself is insufficient to estimate theexpected impacts on the Sleepy Hollow Timberland conversion.
O’Conner Environmental (March 2002) prepared an,Assessment of Potential Hydrologic Effects, Fairfax Timber Harvest Plan andConversion. The Fairfax Timberland Conversion is located about ½ mile to thesoutheast of the Sleepy Hollow Timberland Conversion. The Fairfax Conversion isat a similar elevation. The O’Conner report for the Fairfax conversion arguesthat the North Fork of Caspar Creek was clearcut and therefore would allowreasonable extrapolation of the results of the Caspar Creek study. Portions ofthe North Fork of Caspar Creek were clearcut and so would, at first glance,appear to be directly applicable to a timberland conversion to vineyard.However, the North Fork of Caspar Creek has significant areas of north exposure(higher soil moisture content than flat or south facing slopes) and there aresignificant areas with slopes greater than those found on the Sleepy Hollowconversion. The effect of slope, aspect and relative soil water content werenot examined in the Caspar Creek studies. However, the studies, particularlythose of the South Fork selective logging offer some insights concerning thevariables that were not directly investigated in the Caspar Creek studies.
The Keppeler and Ziemer (1990) discuss the factorsassociated with variations in the streamflow response. They note on page 1674that:
High antecedent moisture conditions preceding and during thehydrologic year were related to an increase in the South Fork flow relative tothe North Fork.
This reflects the idea that when the soil is atsaturation, the actual evapotranspiration is close to the potentialevapotranspiration (PET). As soil moisture declines the trees have to reducetheir actual evapotranspiration to levels well below that of the PET. So, theCaspar Creek study supports the idea that the magnitude of any increase insummer streamflow resulting from logging depends on the antecedent soilmoisture conditions. That is, there will be less or no increase in summerstreamflows following dry winters. This is further supported by the 1998article by E.T. Keppeler. The following quote from page 36-37 of the Keppeler articlewas overlooked by the O’Conner report.
On SFC, the minimum discharge (instantaneous daily flow)increased an average of 38 percent or 0.25 L/s/sq-km between 1972 and 1978. Themaximum increase was 0.42 L/s/sq-km in 1973, the final year of timber harvestingon this watershed. No increases were detected in 1977, the driest year ofrecord. Summer discharge minimum returnedto prelogging levels beginning in 1979. (Emphasis added).
The effect of removing trees on summer streamflow is alsonot uniform in space. The Caspar Creek study can be seen to support the ideathat removing trees from drier sites will have less impact on summer streamflowthan removing trees from wetter sites especially those with nearly saturatedsoil. Since most of the Sleepy Hollow Timberland conversion is on flat groundor on south facing slopes, it is reasonable to expect that the trees will beremoved from relatively dry sites. In contrast, a significant portion of theNorth Fork of Caspar Creek faces north and so would be expected to have highersoil moisture content. In addition, the clearcuts in the North Fork of CasparCreek probably removed trees that were closer to the stream channel network andso grew on sites with elevated soil moisture than the trees that will beremoved as part of the Sleepy Hollow conversion. So, the actual change insummer streamflow may be significantly less downstream of the Sleepy Hollowconversion than the changes seen in the Caspar Creek study.
Studies presented in Dunne and Leopold (pages 253-274) showthat areas with saturated or nearly saturated soil moisture conditions tend tobe concentrated on the hillslopes above stream channels. The saturated areatends to contract as the time after precipitation increases but the saturatedarea continues to be centered on the stream channel network. These studiessupport the idea that the location of tree removal, with respect to topographicposition, plays a significant role in determining the response of the summerlow flow to logging.
Another significant difference between the clearcuts onthe North Fork of Caspar Creek and the Sleepy Hollow Timberland conversion isthe installation of the subsurface drain system in the vineyard after the treesare removed. The Caspar Creek study sheds no light on how the vineyard drainsystem may impact the peak discharges and the summer low flows in upper LittleCreek.
Furthermore, properly assessing the impacts of thehydrologic changes associated with the timberland conversion should not bebased on “average conditions” but on extremes. During dry years there may be noincrease in summer streamflow associated with the removal of trees during thetimberland conversion. And in fact, the extensive vineyard drainage system maylead to a significant decrease in summer flows because the piping system willspeed the draining of the soil.
Water Budget
A detailed water budget should be prepared for thisproject as part of an EIR. The discussion of vineyard water use, dry seasonflows and the effects of converting a forest to vineyards are discussedseparately and have not been linked. The water budget must like the increasedstorm flows, decreased deep percolation to the groundwater table, andconsumption of groundwater to water the vineyard.
Conversion of forest to vineyard will change theinfiltration and canopy interception processes. The conversion will result ingreater storm flows. The forest that will be removed is on flat to south-facingslope, the removal of the trees may not increase summer streamflow since it isunlikely that tree roots are in contact with the water table. The trees aremost likely drawing water from the unsaturated soil on the hillslopes. However,the use of the well to water the vineyard will diminish the volume of waterstored in the water table by at least 4.05 acre-feet per year.
A detailed water budget needs site-specific informationthat can only be obtained by performing a 72-hour constant-discharge pump testto determine the aquifer characteristics.
Increased Peak Flows to Little Creek
The ECP analysis of peak flows is flawed. On page 36 ofthe THP, the ECP states that:
Peak Flows: Estimates of surface runoff and associatedflow rates are necessary for drainage design to meet erosion controlobjectives. Peak flow rate estimates were developed using Rational Methodprocedures. Per Plate B3 in the Sonoma County Water Agency Flood ControlManual, this ridge crest location at about 800 feet elevation with an estimatedaverage annual rainfall of about 70” (5.83’). For the 100-year 15-minute stormat 2.4 inches/hour and a 45% runoff factor, design flows are estimated atQ=.45*2.4*(70/30) = 2.52 cubit feet per second per acre. Peak flows for theUSDA Type II storms expected in coastal California have relatively shortduration, with the flows noted expected for only a matter of minutes. In a24-hour period, estimated flow rates will exceed 2/3 of the values noted foronly about an hour.
Time of Concentration and peak flows from individual vineyardsubwatersheds will be similar for both pre-construction and post-constructionconditions. Piped drainage is not believed required in the proposed vineyardsbecause vineyard development has been excluded from areas of concentratedflows, including all Class III waterways. Runoff patterns will not be modified.The post-construction condition of permanent grass cover crop is expected tohave similar infiltration and frictional characteristics as the existing secondgrowth harvest. (emphasis added)
The ECP claims that there will be no change in peak runofffrom the Timberland Conversion area. This claim is not supported by anyevidence and appears to be in conflict with results from research at CasparCreek and other locations.
O’Conner Environmental (March 2002) prepared an,Assessment of Potential Hydrologic Effects, Fairfax Timber Harvest Plan andConversion. The Fairfax Timberland Conversion is located about one-half mile tothe southeast of the Sleepy Hollow Timberland Conversion. The FairfaxConversion is at a similar elevation. The Fairfax Conversion encompassed Goldridge15% to 30% soil type and the Hugo 30% to 50% soil type. So, the O’ConnerEnvironmental report for the Fairfax Conversion should be directly applicableto the Sleepy Hollow Timberland Conversion. Page 80.4 ofthe March 2002 O’Conner Environmental Report on the Fairfax conversion statesthat:
The conversion of forest vegetation to vineyard will reduce theinterception and evaporation f rainfall by forest canopy. Experimental dataindicate that forest canopy intercepts and evaporates approximately 20% ofstorm precipitation in temperate coniferous forests (Dunne and Leopold 1978,pp. 87-88). Removal of the forest canopy therefore is expected to increase thequantity of precipitation reaching the ground surface, potentially causingincreases in
Infiltration of water to the soil and percolation to thegroundwater aquifers
Summer streamflow
Storm runoff
These potential effects are discussed below in the context ofregional scientific studies of redwood forest watershed hydrology.
The O’Conner report anticipates increases in infiltrationand storm runoff, but the ECP for the Sleepy Hollow Timberland Conversionclaims, without evidence, that no changes will occur after the TimberlandConversion
Page 80.5 of the March 2002 O’Conner Environmental Reporton the Fairfax conversion states that:
In summary, watershed experiments at Caspar Creek indicate substantialincreases in annual water yield, summer minimum flows, and storm runofffollowing clearcut harvest in the North Fork Caspar Creek. In addition,suspended sediment yield for small watersheds (about 25 to 70 acres) increasedsubstantially. Increased annual water yield is due largely to increased stormrunoff which results from decreased canopy interception of rainfall andincreased soil moisture; increased summer flows are significant, but representa smaller portion of the increased annual yield. Increased summer minimum flowsresult primarily from reduced growing-season evapotranspiration and higher soilmoisture. The increasing trend in these parameters and approximate magnitude ofchange is likely to be similar conversion of forest to vineyard at the projectsite near Annapolis. (emphasis added)
The Caspar Creek study, cited by O’Conner, presentsevidence from a watershed near Fort Bragg, CA that demonstrates that peak flows(storm runoff) are increased by clearcutting. Clearcutting is a required stepin the Timberland Conversion process. Therefore, it is likely that the upperportion of Little Creek, closest to the conversion area, will experience asignificant increase. The Caspar Creek studies found a mean peak flow increaseof 27% for storms with a 2-year recurrence interval on clearcut watershedsranging from 25 to 67 acres (O’Conner Environmental, March 2002, p80.5). Theincrease in peak flow diminishes as the proportion of the watershed clearcutdeclines. Therefore, the greatest effect will be near the conversion area.
O’Conner reports that:
Lewis (1998) found that suspended sediment yield measured fromthe small watersheds increased on the order of 200% (a three fold increaseafter harvest). Although the source of this increase in suspended sediment wasnot determined, it was suggested that a substantial portion was caused byaccelerated channel or bank erosion associated with observed increases in streamflow.
Therefore, the expected 27% increase in the magnitude ofpeak flows in the Class I, Class II and Class III watercourses near the SleepyHollow Timberland Conversion are also expected to have a significant andmeasurable increase in suspended sediment load. The Caspar Creek researchers suggested, but did not determine, that a substantial portionof the increase in sediment load was from erosion of the channel bed and banks.The expected increase in peak flow magnitude in the watercourses near the Conversionresults in apparent violations of the three Forest Practice Rules listed below(emphasis added):
916.9(a)(1) Comply with the terms of a Total MaximumDaily Load (TMDL) that has been adopted to address factors that may be affectedby timber operations if a TMDL has been adopted, or not result in any measurablesediment load increase to awatercourse system orlake.
916.9(a)(2) Not result in any measurable decrease inthe stability of a watercourse channel or of a watercourse or lake bank.
916.9(a)(7) Result in no substantial increases inpeak flows or largeflood frequency.
The expected increases in peak flows will violate916.9(a)(7). The expected increase in peak flows from the timberland conversionwill measurably decrease the stability of the bed and banks of upper LittleCreek in violation of Rule 916.9(a)(2). The anticipated erosion of the bed andbanks of the Class II, Class III and possibly the Class I watercourses on theMartin property in upper Little Creek will result in a measurable increase insediment load in violation of Rule 916.9(a)(1).
The expected erosion of the bed and banks of thewatercourses near the Sleepy Hollow Timberland Conversion, as they adjust tothe expected increased magnitude of peaks flow, may result in a direct potentialadverse impact to the steelhead habitat in Little Creek downstream of theConversion. The steelhead habitat in Little Creek may also be incrementallyimpacted by the sediment generated from the Sleepy Hollow Timberland Conversionand other harvests or conversions in the Little Creek watershed.
Since steelhead, a federally listed species, are known toinhabit the lower reaches of Little Creek, a complete analysis of theenvironmental impacts, including cumulative impacts, of the Sleep HollowTimberland Conversion require analyzing the impact of increased peak flows andthe resulting increase in sediment from the Sleepy Hollow Timberland conversionand other harvests or conversions in the Little Creek watershed on the variousreaches of Little Creek.
The ECP claims that (page 46 of the THP)
This observation is intended to place the proposed developmentwithin the context, and to point out that a zero net discharge is not anappropriate criteria by which to judge new vineyard performance.
However, the Forest Practice Rules quoted above show thatthe Timberland Conversion must not generate and measurable sediment ormeasurable increases in peak flows and must not destabilize and channel bed orbank.
Ignoring the potential environmental impacts from increasedstreamflows on the steelhead in lower Little Creek invalidates the conclusionthat the timberland conversion permit for the Sleepy Hollow conversion projectcan be issued under the proposed Mitigated Negative Declaration. CDF shouldeither deny the application for the Sleepy Hollow Timberland Conversion orshould require an EIR.
Future Studies
The purpose of the California Environmental Quality Act(CEQA) is to provide full disclosure of potential environmental impacts toregulatory agencies and the public. Allowing portions of a project to bedesigned after project approval circumvents the full disclosure requirements ofCEQA. In Sundstrom v County of Mendocino(1988) 202 Cal. App. 3d 296, the Court concluded that the effectiveness ofmitigations based on a future study was uncertain, so the county could not havereasonably concluded that the project did not have the potential forsignificant environmental impacts. The court also found that the county’sdeferral of the analysis of significant environmental impacts to a future studywas an inappropriate delegation of the its CEQA responsibilities.
The California Department of Forestry (CDF) is violating CEQAby allowing the applicant to delay final design of the drainage, erosioncontrol and water supply plans until after the approval of the project. TheMitigated Negative Declaration for the Sleepy Hollow timberland conversionrelies on conceptual drainage and erosion control plans to determine if impactswould occur.
The discussion of Vineyard Runoff System DesignConsiderations also states (THP page 40):
Mitigation for any potential increased runoff rate in vineyardsincludes measures to limit flow velocity and exposure to unprotected soil asdiscussed in the Erosion Control Methods section below.
The Erosion Control Methods section (THP pages 42-44) is alist of design specifications. Final site-specific design specifications arenot provided. Therefore, the effectiveness of the mitigations to control themagnitude of the peak flow cannot be judged. This is particularly troublingsince the potentially increased storm runoff from the proposed timberlandconversion would enter into either Little Creek, which is known to be used bysteelhead. Increased peak runoff has the potential to damage salmonid habitatthrough increased erosion and sedimentation and to scour eggs from redds.
The ECP only discusses mitigations for any vineyard runoffin a conceptual manner. The ECP goes on to say that:
Watershed peak flows at vineyard outfalls could be developed aspart of a drainage system design and evaluation.
CDF should require that this be done as part of acomprehensive Environmental Impact Report (EIR) for this project. There is noneed to wait until the forest has been cleared prepare estimates of peak flowsat vineyard outfalls. CDF required the Fairfax Timber Harvest Plan andConversion (THP 1-01-171 SON) to prepare peak flow estimates during theenvironmental evaluation of the Timberland Conversion (O’Conner March 2002).
Inadequate Mitigations
The Mitigated Negative Declaration lists the effects ofthe proposed Sleepy Hollow Timberland Conversion and proposes mitigations toreduce the adverse environmental impacts. However, in my professional opinion,some of the proposed mitigations are insufficient to reduce the identifiedimpacts to less than significant.
Page 8 of the Mitigated Negative Declaration lists thefive effects (a-e) of the Timberland Conversion.
(a) Sediment: ….Sediment movement from the proposed operationwill be minimized due to the “no winter operations” requirement, the residualvegetative cover within the adjacent class III watercourses, and the use ofexisting landings, roads and skid trails.
The proposed mitigations for Sediment are insufficient toreduce the adverse impact of sediment generated by the Sleepy Hollow TimberlandConversion to less than significant. The project will probably increase peakflows in the Class II and Class III watercourses within the plan, which willcause erosion of the bed and banks of the watercourses.
Note, the Mitigated Negative Declaration incorrectlyrefers to the Class III watercourses as being adjacent to the Plan when in factthey are surrounded by the plan. The Mitigated Negative Declaration has notbeen updated to reflect the fact that the PHI upgraded a Class III watercoursein the southeast corner of the Plan to a Class II watercourse.
No evidence has been presented in the THP or the MitigatedNegative Declaration that a permanent cover crop will not deliver measurableamounts of sediment to the watercourses within the plan. In addition, theCalifornia Forest Practice Rules have not been certified to protect thebeneficial uses of water by the federal EPA or the State Water ResourcesControl Board or any of the Regional Water Quality Control Boards.
(b) Water Temperature: ….The proposed operation will have nosignificant impact on stream temperature due to the absence of any class I, IIor III watercourses within the project.
This claim is false. There is a Class II watercourse andseveral Class III watercourses within the Plan area. This false claim isdiscussed in depth in the first section of this letter.
(c) Organic Debris: Trees shall be felled away fromwatercourses when feasible. Organic debris introduced into the channel of anyClass III watercourse to the extent the flow is altered, shall be removed assoon as possible prior to October 1. Due to past logging practices, streamchannels have in places, higher than natural amounts of large woody material inall class I and class II watercourses. (emphasis added)
The above bolded statement appears to be in conflict withthe findings of the NCWAP Report for the Gualala River. The NCWAP report statesthat the lack of large woody debris in class I streams is adversely affectingsteelhead habitat.
(e) Peak Flows: Increase in peak flows should not besignificant due to the gentle terrain, broken ground, and the retention ofvegetation and ground cover within the adjacent class III watercourse riparianareas.
The conversion from forest to a permanent cover crop willchange the interception and infiltration processes and is likely to result inincreased peak flows. Studies at Caspar Creek show that clearcutting, arequired step in the conversion process, increased peak flow an average of 27%on small watersheds (25-67 acres).
Note the Mitigated Negative Declaration incorrectly refersto the Class III watercourses as being adjacent to the Plan when in fact theyare surrounded by the plan. The Mitigated Negative Declaration has not beenupdated to reflect the fact that the PHI upgraded a Class III watercourse inthe southeast corner of the Plan to a Class II watercourse.
The Mitigated Negative Declaration lists eight potentiallysignificant impacts starting on page 33 of47.
Potentially Significant Impact 3: The proposed project couldpotentially impact endangered, threatened, rare or species of special concernwithin or adjacent to the plan area. The potential degradation of water qualitycould impact fish and fish habitat downstream. ….(emphasis added).
To address the bolded potential adverse impact above, theMitigated Negative Declaration proposes Mitigation Measure 3.4
Mitigation Measure 3.4: The potential degradation of waterquality that could potentially impact fish and fish habitat shall be mitigatedby not permitting operations between October 15 and April 1. The planting of acover crop prior to the winter period and the designing and development of anErosion Control Plan shall mitigate runoff. By restricting operations to slopesless than 20% and requiring setbacks from watercourses between 25 and 50 feetthe impact to water quality and fish and fish habitat will be insignificant.
According to the original THP/Conversion Plan (page 10),
No operations are proposed between October 1 and May 1, excludingerosion control maintenance. All bare soil shall be fully stabilized by October1 and operations shall not resume until after May 1 of the following year whensoils have achieved a dry condition.
The original period of no operation provides environmentallysuperior protection compared to the weakened no-operation period proposed underMitigation Measure 3.4. No justification is given in the Mitigated NegativeDeclaration for the shorter period of no-operations. The portion of MitigationMeasure 3.4 concerning the no-operation period should be change to the languageused in the original THP quoted above.
Mitigation Measure 3.4 proposes to restrict operations toslopes less than 20%. This should be clarified to read,
By restricting Timberland Conversion operations to slopes lessthan 20%….
Mitigation Measure 3.4 again weakens the language from theoriginal THP/conversion by requiring setbacks from watercourses of only 25 to50 feet instead of the 50 feet setback from all class III watercourse and 75foot setback from the Class II watercourse. No justification is presented fordiminishing the protection of water quality and fish habitat. MitigationMeasure 3.4, as written is inadequate to prevent significant adverse impacts tothe environment.
Potentially Significant Impact 6: The conversion of forestlandto vineyard could impact the hydrology of the surrounding area and the waterquality of site specific class III watercourses, off-site class IIwatercourses, Little Creek, Buckeye Creek and the Gualala River.
Impact 6 has not been updated to reflect the PHI whichupgraded a Class III watercourse to a Class II watercourse. The followingmitigation was proposed to deal with Impact 6.
Mitigation Measure 6.1: To offset the degradation of waterquality a riparian buffer has been developed (25’ adjacent to slopes < 30%and 50 feet adjacent to slopes > or equal to 30%) surrounding the class IIIwatercourses. A cover crop shall be planted prior to the winter period upon theremoval of forest vegetation to inhibit the erosion of soil and the transportof sediment. An Erosion Control Plan shall be designed by a qualified engineerand administered by a vineyard management company.
Mitigation Measure 6.1 is in conflict with MitigationMeasure 3.4. Mitigation Measure 3.4 limits operations to slopes less than 20%.Since operations includes the timberland conversion, Mitigation 3.4 means thatno land with slopes greater than 20% shall be cleared as part of the SleepyHollow Timberland Conversion.
The original THP (page 12) states that, “…class IIIwatercourses will be given a 50 foot riparian buffer. During the PHI, a classIII watercourse was upgraded to a class II watercourse and was given a 75 footriparian buffer. Therefore, Mitigation Measure 6.1 attempts to weaken theprotections offered by the original THP.
The Draft Mitigation Monitoring and Reporting Plan doesnot correctly reflect Mitigation 3.4 as described on page 34 of 47 since itfails to mention the restriction of operations to slopes of less than 20%.
Part IV Biological Resources of the Mitigated NegativeDeclaration does not reflect the June 10, 2004 PHI since erosion of a nickpoint and a fill slope at Area C were added during the PHI are not discussed inthe Mitigated Negative Declaration. Mention of the class III watercourse thatwas upgraded to a Class II watercourse is also not mentioned. The Descriptionin the Biological Resources section is also incorrect since the proposedvineyard is proposed to cover only 20 of the acres of the conversion.
As written the Mitigated Negative Declaration does notreflect the proposed Sleepy Hollow Timberland Conversion. The proposedmitigations are not adequate to protect water quality, water quantity,steelhead or steelhead habitat from adverse environmental impacts.
Conclusions
The initial study relies on reports that use suspect dataand superficial and incomplete analysis to determine that there would be nosignificant adverse impacts to the environment resulting from the Sleepy HollowTimberland conversion and associated THP. The Mitigated Negative Declarationhas not been updated to reflect the June 10, 2004 PHI. The Mitigated NegativeDeclaration reduces the environmental protections compared to the original THPin regards to water quality issues. No justification is given for the reductionin the protection for water quality.
A careful analysis using data from more than one sourceshows that a variety of significant hydrologic impacts may arise from theSleepy Hollow Timberland conversion. These impacts include but are not limitedto:
· Insufficientirrigation water for establishment of the vineyard and during dry years maylead to development of additional water sources with unknown environmentalimpacts or even abandonment of the vineyard.
· Pumpingthe groundwater within the Ohlson Formation may reduce the spring flow in thesoutheast corner of the plan.
· Significantlyincreased peak flows entering the class II and class III watercourses in upperreaches of Little Creek from several vineyard outlets, the increased peak flowswould be expected to increase erosion of the bed and banks of Little Creek. Theresulting additional sediment load may have an adverse impact on steelhead andtheir habitat in lower Little Creek. The increased peak flows may also have anadverse effect on the aquatic habitat of upper Little Creek.
· Thepotential for significantly increased levels of suspended sediment in the classII and class III watercourses in upper Little Creek. The resulting additionalsediment load may have an adverse impact on steelhead in lower Little Creek.The additional sediment load may also have an adverse effect on the aquatichabitat of upper Little Creek.
The Project Description in the Mitigated Declaration isincomplete and misleading. The THP failed to properly identify a Class IIwatercourse in the southeast portion of the plan. The maximum slopes within theconversion area are underestimated. The RWQCB PHI report notes that slopes inthe area of the misclassified Class II watercourse were measured at 45% whichis much steeper than the maximum slope of 18% cited in the THP and in theMitigated Negative Declaration. The steeper areas appear to have a High ErosionHazard Rating. The presence of steep slopes with in the Timberland Conversionarea probably also triggers the need to comply with the Sonoma County gradingOrdinance.
The failure for the slopes and watercourses to be properlycharacterized may result in the public and Responsible Agencies from properlyassessing the potential for significance of adverse impacts from the Project.Because of these deficiencies in the Project Description, and inadequacy of theproposed Mitigated Negative Declaration, CDF should prepare an EIR for theSleepy Hollow Timberland Conversion. If an EIR is not required, CDF should preparea new Mitigated Negative Declaration and re-circulate it for public comment.
Therefore, the Department of Forestry should either denythe application for a timberland conversion permit for the Sleepy Hollowconversion or should require the preparation of an Environmental Impact Report(EIR).
Sincerely,

Dennis Jackson
Hydrologist
References
Dunne, T. and L.B. Leopold, 1978. Water in EnvironmentalPlanning. W.H. Freeman and Company.
Keppeler, E.T.1998. The summer flow and water yield response to timber harvest. PSW-GTR-168,Pacific Southwest Research Station.
Keppeler, E.T.and R.R. Ziemer, 1990. Logging Effects on Streamflow: Water Yield and SummerLow Flows at Caspar Creek in Northwestern California. Water Resources Research,Vol 26, No. 7, pages 1669-1679, July 1990.
O’ConnerEnvironmental, Assessment of Potential Hydrologic Effects, Fairfax TimberHarvest Plan and Conversion Number 1-01-171 SON, Grasshopper Creek andAnnapolis Watersheds, Sonoma County, March 15, 2002
Rantz, S.E. andT.H. Thompson, 1967. Surface-Water Hydrology of California Coastal BasinsBetween San Francisco Bay and Eel River. U.S. Geological Survey Water-SupplyPaper 1851. Prepared in cooperation with the California Department of WaterResources.
Rantz, S.E.1974. Mean Annual Precipitation in the San Francisco Bay Region, California,1931-70. Miscellaneous Field Studies Map MF-613.
Reid, L.M.,1998. Cumulative Watershed Effects: Caspar Creek and Beyond. PSW-GTR-168,Pacific Southwest Research Station.
Ziemer, R.R. 1997.Caspar Creek Thornthwaite potential evaporation, water years 1990-1995. U.S.Forest Service, Pacific Southwest Research Station, Redwood SciencesLaboratory, Arcata, CA. See web site:
http://www.rsl.psw.fs.fed.us/projects/water/Thornthwaite.html,
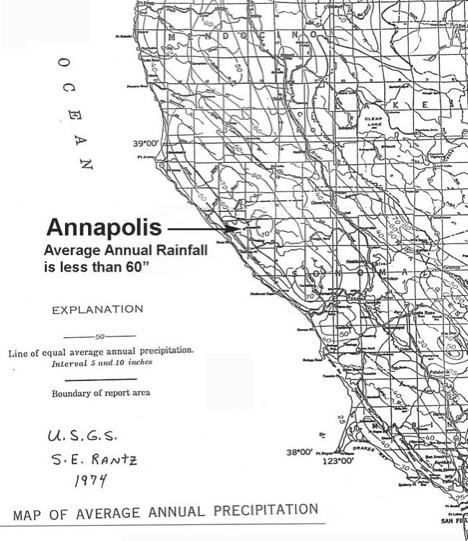 Figure 1. Map of average annualprecipitation from the USGS shows that the mean annual precipitation inAnnapolis is less than 60 inches. The 18-years of rainfall data collect by theSmith’s at 34440 Annapolis Road is 53.61 inches. The Smith rainfall data is inagreement with the USGS precipitation map.
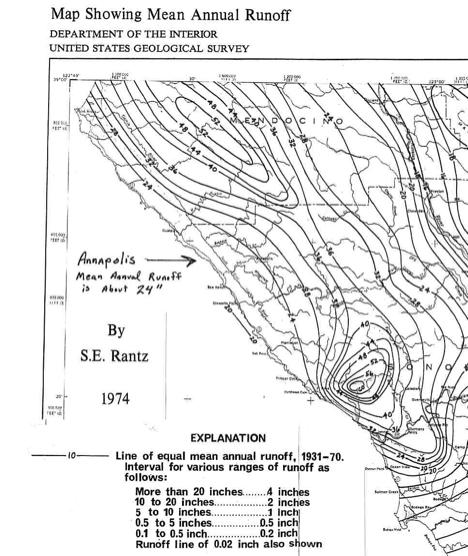 Figure 2. The USGS runoff map showsthat the mean annual runoff for Annapolis is about 24 inches
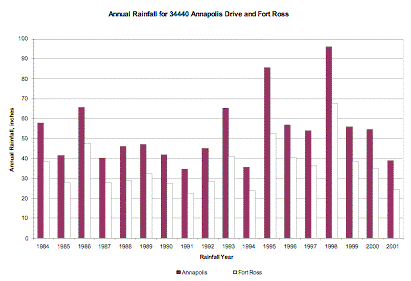
Figure 3. Theupper graph shows the annual rainfall recorded by the Smith family graphed nextto the annual Fort Ross precipitation downloaded from the California DataExchange (CDE) web site.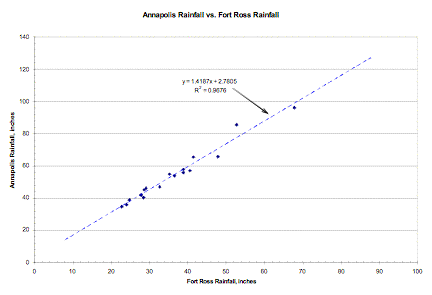 The lower graph shows the linearregression of the Annapolis rainfall versus the Fort Ross rainfall.
Table1. The Smith family rainfall data for1984-2001 and the corresponding Fort Ross rainfall data are shown below. Alinear regression performed on the above data found the following equation,Smith Rainfall = 1.419 x (Fort Ross Rainfall) + 2.780 with an R2 =0.9676. The regression is graphed in Figure 3.
|
Year
|
Fort Ross Annual Precipiation (Inches)
|
Annapolis Annual Precipitation (inches)
|
Annapolis vs Fort Ross Regression | ||||
|
1984
|
38.8
|
57.91
|
Intercept |
|
|||
|
1985
|
27.78
|
41.73
|
Slope |
|
|||
|
1986
|
47.8
|
65.87
|
R-Sq |
0.96764
|
|||
|
1987
|
28.4
|
40.35
|
|||||
|
1988
|
29.09
|
46.14
|
|||||
|
1989
|
32.6
|
47.03
|
|||||
|
1990
|
27.74
|
42.05
|
|||||
|
1991
|
22.69
|
34.64
|
|||||
|
1992
|
28.57
|
45.19
|
|||||
|
1993
|
41.39
|
65.56
|
|||||
|
1994
|
23.94
|
35.89
|
|||||
|
1995
|
52.67
|
85.57
|
|||||
|
1996
|
40.5
|
57.05
|
|||||
|
1997
|
36.48
|
53.97
|
|||||
|
1998
|
67.74
|
96.22
|
|||||
|
1999
|
38.8
|
55.94
|
|||||
|
2000
|
35.19
|
54.86
|
|||||
|
2001
|
24.7
|
38.97
|
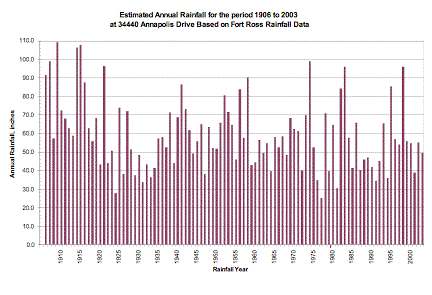 Figure 4. The rainfall recorded by the Smith family wasextended to the period 1906 to 2003 using the regression described in Figure 3.The average for the 98 years of extended record shown is 59.55”. The averagefor the 18 years recorded on Annapolis Drive is 53.61”
Table 2. Annapolis rainfall from SteveMcLaughlin of the Independent Coast Observer, PO Box 1200 Gualala, CA 95445 Phone (707) 884-3501;FAX (707) 884-1710.
| Rainfall Year | Annapolis Rainfall from Independent Coast Observer |
| 70-71 | na |
| 71-72 | na |
| 72-73 | na |
| 73-74 | na |
| 74-75 | na |
| 75-76 | na |
| 76-77 |
28.13
|
| 77-78 |
84.66
|
| 78-79 |
52.05
|
| 79-80 |
69.66
|
| 80-81 |
49.05
|
| 81-82 |
93.78
|
| 82-83 |
103.04
|
| 83-84 |
63.13
|
| 84-85 |
37.46
|
| 85-86 |
70.36
|
| 86-87 |
39.10
|
| 87-88 |
49.50
|
| 88-89 |
45.90
|
| 89-90 |
51.74
|
| 90-91 |
33.68
|
| 91-92 |
45.42
|
| 92-93 |
61.69
|
| 93-94 |
37.10
|
| 94-95 |
89.39
|
| 95-96 |
58.53
|
| 96-97 |
61.06
|
| 97-98 |
100.78
|
| 98-99 |
57.05
|
| 99-00 |
55.22
|
| 00-01 |
45.95
|
| 01-02 |
52.21
|
| 02-03 |
63.88
|
| 03-04 |
57.05
|
| Years |
28
|
| Average |
59.16
|
| Median |
56.14
|
| Maximum |
103.04
|
| Minimum |
28.13
|
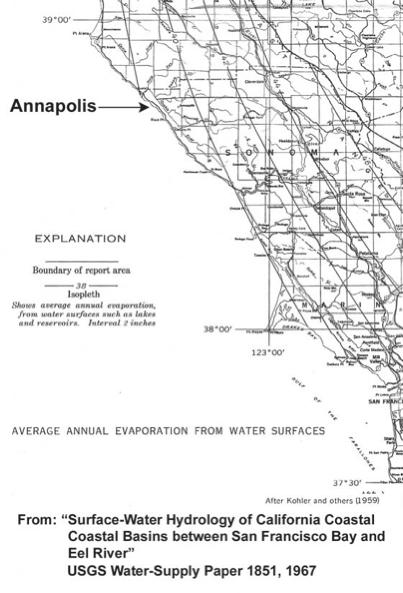 Figure 5. Map showing that the averageannual evaporation from water surfaces in the Annapolis area is between 38 and40 inches per year.
Table3. The total annual rainfall (in inches)for various levels of exceedence probability for the Fort Ross data (1906-2003)and for the Annapolis rainfall data extended to the same time period. 95% ofthe years, the rainfall around Annapolis will equal or exceed 34.9”. The estimatedmedian (50% exceedence probability) rainfall near Annapolis is estimated to be56.88”. The extended Annapolis average rainfall is 59.55” and is greater thanthe median (exceedence probability of 41%). The 70” used as the averagerainfall near Annapolis has an exceedence probability of 23.6%. The summarystatistics for each rainfall record are shown in the table below the exceedenceprobability table.
|
Exceedence Probability
|
Fort Ross Rainfall
|
Extended Annapolis Rainfall
|
|
99%
|
17.6
|
27.8
|
|
98%
|
19.4
|
30.4
|
|
95%
|
22.7
|
34.9
|
|
90%
|
24.8
|
38.2
|
|
85%
|
26.2
|
40.1
|
|
80%
|
28.5
|
43.0
|
|
75%
|
29.2
|
44.5
|
|
70%
|
32.3
|
48.2
|
|
65%
|
34.5
|
51.2
|
|
60%
|
35.3
|
52.7
|
|
55%
|
37.0
|
55.3
|
|
50%
|
38.5
|
57.1
|
|
45%
|
39.0
|
58.0
|
|
40%
|
41.4
|
61.7
|
|
35%
|
42.7
|
64.1
|
|
30%
|
44.8
|
65.8
|
|
25%
|
47.2
|
68.9
|
|
20%
|
48.8
|
72.0
|
|
15%
|
54.0
|
82.7
|
|
10%
|
60.5
|
88.7
|
|
5%
|
66.3
|
96.9
|
|
2%
|
73.1
|
106.5
|
| Average |
39.98
|
59.55
|
| Maximum |
75.19
|
109.45
|
| Minimum |
16.01
|
25.49
|
| Median |
38.37
|
56.88
|
| Count |
98
|
98
|
Table4. The annual runoff/rainfall ratio wascalculated for each year from 1931 to 1970 for the South Fork of the GualalaRiver. Runoff data from Rantz, 1974, runoff map.
|
Year
|
South Fork of Gualala River Annual Discharge (1,000 ac-ft)
|
S. F. Gualala Annual Discharge (inches)
|
Fort Ross Water Year Precipitation (inches)
|
Estimated Watershed Precipitation S.F. Gualala River (inches)
|
Runoff Ratio
|
|
1931
|
63.8
|
7.43
|
21.82
|
28.82
|
25.79%
|
|
1932
|
166.9
|
19.44
|
28.7
|
37.90
|
51.28%
|
|
1933
|
132.2
|
15.40
|
23.64
|
31.22
|
49.32%
|
|
1934
|
116.5
|
13.57
|
27.38
|
36.16
|
37.52%
|
|
1935
|
232.9
|
27.12
|
38.52
|
50.87
|
53.32%
|
|
1936
|
293.5
|
34.18
|
38.9
|
51.37
|
66.54%
|
|
1937
|
155.4
|
18.10
|
35.06
|
46.30
|
39.09%
|
|
1938
|
608.3
|
70.84
|
48.39
|
63.90
|
110.86%
|
|
1939
|
93.5
|
10.89
|
29.18
|
38.53
|
28.26%
|
|
1940
|
408.6
|
47.59
|
46.63
|
61.58
|
77.28%
|
|
1941
|
504.9
|
58.80
|
58.99
|
77.90
|
75.48%
|
|
1942
|
462.4
|
53.85
|
49.56
|
65.45
|
82.28%
|
|
1943
|
260.3
|
30.31
|
41.64
|
54.99
|
55.13%
|
|
1944
|
124.3
|
14.48
|
32.66
|
43.13
|
33.56%
|
|
1945
|
179.6
|
20.92
|
37.37
|
49.35
|
42.38%
|
|
1946
|
274.7
|
31.99
|
43.85
|
57.91
|
55.25%
|
|
1947
|
107.1
|
12.47
|
25.05
|
33.08
|
37.70%
|
|
1948
|
189.3
|
22.05
|
43.02
|
56.81
|
38.81%
|
|
1949
|
218
|
25.39
|
34.84
|
46.01
|
55.18%
|
|
1950
|
142.1
|
16.55
|
34.59
|
45.68
|
36.23%
|
|
1951
|
341.4
|
39.76
|
44.42
|
58.66
|
67.78%
|
|
1952
|
434.1
|
50.56
|
54.94
|
72.55
|
69.68%
|
|
1953
|
342.5
|
39.89
|
48.52
|
64.07
|
62.25%
|
|
1954
|
341.1
|
39.72
|
43.57
|
57.54
|
69.04%
|
|
1955
|
171.6
|
19.98
|
30.36
|
40.09
|
49.85%
|
|
1956
|
464.6
|
54.11
|
57.3
|
75.67
|
71.50%
|
|
1957
|
222.4
|
25.90
|
38.69
|
51.09
|
50.69%
|
|
1958
|
560.3
|
65.25
|
61.64
|
81.40
|
80.16%
|
|
1959
|
178.5
|
20.79
|
28.34
|
37.43
|
55.55%
|
|
1960
|
224.2
|
26.11
|
29.38
|
38.80
|
67.30%
|
|
1961
|
270.9
|
31.55
|
38.01
|
50.20
|
62.85%
|
|
1962
|
266.1
|
30.99
|
33.01
|
43.59
|
71.09%
|
|
1963
|
307.1
|
35.76
|
36.61
|
48.35
|
73.98%
|
|
1964
|
138
|
16.07
|
26.11
|
34.48
|
46.61%
|
|
1965
|
361.5
|
42.10
|
38.98
|
51.48
|
81.79%
|
|
1966
|
234.5
|
27.31
|
35.19
|
46.47
|
58.77%
|
|
1967
|
359
|
41.81
|
39.3
|
51.90
|
80.56%
|
|
1968
|
195.7
|
22.79
|
32.22
|
42.55
|
53.56%
|
|
1969
|
400
|
46.58
|
46.36
|
61.22
|
76.09%
|
|
1970
|
407.6
|
47.47
|
42.03
|
55.50
|
85.52%
|
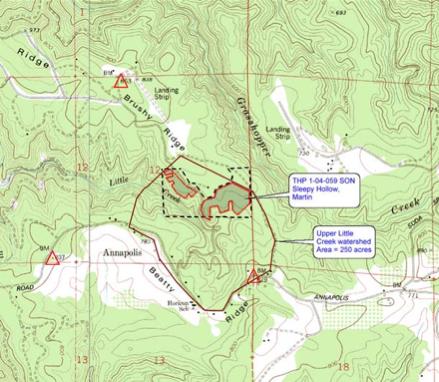 Figure 6. The Sleepy Hollow TimberlandConversion is in the upper Little Creek watershed, a tributary of BuckeyeCreek. The shaded areas are proposed to be cleared under the TimberlandConversion permit. The upper Little Creek watershed area is about 250 acres.The Timberland Conversion will remove 25 acres or about 10% of the upper LittleCreek watershed.
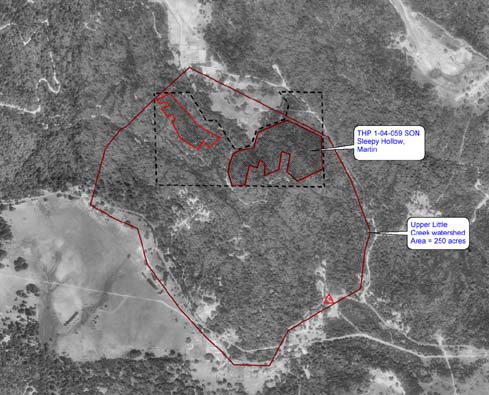
Figure 7. Aerial photo of the Sleepy Hollow TimberlandConversion in the upper Little Creek watershed, a tributary of Buckeye Creek isshown. The shaded areas are proposed to be cleared under the TimberlandConversion permit. The upper Little Creek watershed area is about 250 acres.The Timberland Conversion will remove 25 acres or about 10% of the upper LittleCreek watershed.