 Friends of Gualala River Protecting the Gualala River watershed and the species living within it
March 9, 2005
Attn: ForestPractice
California Department of Forestry and Fire Protection
135 RidgewayAvenue
Santa Rosa, CA 95401
Re: THP 1-00-147 SON
Dear Ms. Markham:
The Friends of the Gualala River have asked me to commenton THP 1-00-147 SON Campbell. I was the Hydrologist for the Mendocino CountyWater Agency (MCWA) from May 1989 to November 1994. The Mendocino County Boardof Supervisors appointed me as their representative on pre-harvest inspectionsfor THPs with the potential to impact public water systems. As the MCWAHydrologist, I also reviewed Proof-of-Water pump tests for the Town ofMendocino. I also routinely reviewed CEQA documents for projects before thePlanning Commission. I have a Masters in Physical Science specializing in Hydrologyfrom Chico State University. Since 1994 I have been a consulting Hydrologist. Ihave also taught Hydrology at California State University, Monterey Bay.
Timberland Conversion Project
The proposed Campbell timberland conversion is located inSonoma County, approximately one-mile northeast of Annapolis. The proposal isto replace 90 acres of coniferous forest with vineyards. The project straddlesa ridge. The Campbell property boundaries are shown on a 7.5-minute topographicmap attached as Figure 1. The northern portion of the proposed conversiondrains to two unnamed tributaries of Buckeye Creek. The southern portion of theconversion drains to Grasshopper Creek, which is a tributary to Buckeye Creek.Both Buckeye Creek and Grasshopper Creek are Class I streams that supportsteelhead, according to Stacy Martinelli, Department of Fish and Game.Steelhead were listed as threatened, in the Northern California ESU, on June 7,2000. Buckeye Creek is a tributary of the Gualala River, which is listed asimpaired for sediment and temperature under Section 303 (d) of the Clean WaterAct. Consequently, the Campbell THP/Conversion must follow the Forest PracticeRule 916.9 Protection andRestoration in Watersheds with Threatened or Impaired Values.
Forest Stormflow is Generated by Subsurface Flow
Hortonian overland occurs when the rainfall intensityexceeds the infiltration rate. Hortonian overland flow plays a minor role inrouting rainfall to the stream channel network in forests. The majority ofstormflow is routed to the stream channel network along subsurface pathways.Selby (1993) notes that:
Field observations indicate that Hortonian overland flow is arare phenomenon, especially in areas with undisturbed vegetation cover and deeppermeable soils. Overland flow is most readily generated in semiaridenvironments with thin, impermeable soils with low water-storage capacity, andin any environments where loss of soil structure (and therefore macropores) bycompaction, removal of vegetation, freezing, and blocking of pores areassociated with prolonged and/or high intensity rainfalls.
Selby goes on to note that:
A ‘variable source area’model came from recognition that in forested uplands, storm runoff may begenerated by subsurface flows: or by surface flows from soils which aresaturated to the soil surface (Hewlett 1961; Dunne and Black 1970b; Dunne1978b). Subsurface stormflow is now regarded as the major runoff-generatingmechanism in most humid environments, both because of its influence on thedevelopment of saturated zones and as an important contributor to stormflow inits own right (Anderson and Burt 1978).
In areas of permeable soils where hydraulic conductivitydecreases with soil depth, subsurface flow moves laterally as throughflowwithin the soil profile. When and where the profile becomes completelysaturated, saturation-excess overland flow will occur. Both processes may occurat rainfall intensities which are well below those required to produceHortonian overland flow. Furthermore, both throughflow and saturation-excessflow may be generated from source areas which are variable in extent anddifferent in location from source areas of Hortonian overland flow.
The proposed Campbell THP/Timberland Conversion project ison Goldridge soils. The description of the soil sample used to type theGoldridge soil series as attached. The basic description of the soil is quotedbelow.
The Goldridge series consists of deep and very deep, moderatelywell drained soils formed in material weathered from weakly consolidatedsandstone. Goldridge soils are on rolling uplands with slopes of 2 to 50percent. The mean annual precipitation is 45 inches and the mean annualtemperature is 56 degrees F.
The Goldridge soil on the project site lies on slopes from0% to 25% and average slope is said to be about 10%. The slope tends toincrease with distance from the crest of the ridge (watershed divide). TheGoldridge soil on the project site was derived from the underlying Ohlson RanchFormation. The Erosion Control and Mitigation Plan (Erickson March 2000) notesthat;
Area soils have been mapped as Goldridge fine sandy loam GdE(15%-30%). They consist of moderately well drained fine sandy loams that have asandy clay loam subsoil and are formed from coarse-grained weakly consolidated sandstone.
This observation is consistentwith the description of the soil sample used to type the Goldridge soil series.The type sample clay content is shown below.
|
Horizon
|
Depth Range
|
Clay Content
|
|
A
|
0″-24″
|
10-20%
|
|
B
|
24″-73″
|
25-35%
|
|
C
|
73″-80″
|
15-25%
|
The higher clay content in the Bhorizon indicates that the B horizon has a lower hydraulic conductivity thanthe overlying A Horizon. The B horizon (subsurface) has a lower infiltrationrate (0.2 to 0.63 in/hr) than the surface A horizon (0.63-2.0 in/hour),according to the Sonoma County Soil Survey. The lower infiltration capacity ofthe B horizon compared to the A horizon is the typical situation in forestsoils (Whipkey and Kirkby, 1978, p127).
The reduced infiltration capacity of the subsurface Bhorizon, due to the higher clay content, provides the very conditions needed topromote subsurface storm flow along the interface of the A and B horizons.There will also be another zone of subsurface flow along the interface betweenthe C horizon and the underlying sandstone of the Ohlson Ranch Formation. Inaddition, groundwater that percolates through the Ohlson Ranch Formation willencounter the nearly impermeable Franciscan Formation and the groundwater willmove downslope along the interface between the Ohlson Ranch Formation and theFranciscan Formation. So, subsurface storm flow will be routed along both theA-B horizon interface and the interface between the C horizon and the OhlsonRanch Formation. In addition, ground water will move downslope along the interfacebetween the Ohlson Ranch formation and the Franciscan Formation.
So, even though the Campbell THP/Timberland Conversion islocated on a ridgetop and the Class-III watercourses begin at or near theboundary of the proposed harvest area, rainfall on the plan area may stillcontribute to stormflow in the unnamed tributaries to Buckeye Creek and inGrasshopper Creek.
Hydrologic Affect of Timberland Conversion Clearcut
The Campbell THP and associated Timberland conversionproposes clearcutting approximately 90 acres in the Buckeye Creek watershed. Aclearcut done in association with a Timberland Conversion is hydrologicallydifferent from a clearcut done in accordance with the standard restocking rulesof the Forest Practice Act. The permanent loss of the forest canopy in aTimberland Conversion is central to the hydrologic difference between aTimberland Conversion clearcut and a restocked clearcut. An assessment of thehydrologic impact of a Timberland Conversion clearcut must consider thepermanent loss of the forest canopy.
The hydrologic impacts of a clearcut are related to thefollowing factors;
- Reduction in evapotranspiration,
- Loss of canopy interception,
- Increases in compaction.
The relative importance of these factors may be differentwhen considering the project’s affect on stream flow during each of threedifferent periods of the year. The three periods of hydrologic interest areearly season storms, later season storms and during the dry season. Thedistinction between early season storms and late season storms can be made onthe basis of the moisture content of the soil column. Early season storms canbe considered those storms that occur when the soil column is relatively dry sothat a portion of the rainfall goes to satisfying the soil moisture deficit.Later season storms are ones that occur after the initial soil moisture deficithas been replenished by the earlier storms. The dry season can be considered tofrom extend from about late April or early May until about mid-November, on average.
In a Timberland Conversion, the forest is not replanted.So the leaf surface-area of the forest canopy is never matched by thesubsequent leaf area of subsequent uses of the land, which in this case is avineyard. During most of the rainy season, grape vines are leafless and so thevines do not provide much surface area to intercept rainfall. Thus the amountof rain intercepted and subsequently evaporated back to the atmosphere ispermanently reduced when a forest in converted to a vineyard. The much smallersurface area of the leaves of a fully developed vineyard can store only afraction of the rainfall as a second growth forest. The rainfall stored in thevegetative cover tends to evaporate, especially on a flat ridgetop that iscompletely exposed to the wind and sun, such as this project. So, converting aforest to a vineyard will allow a higher percentage of the rainfall to reachthe ground. Dunne and Leopold (1978, p87-88) summarize research showing thatthe canopy of a coniferous forest intercepts about 22% of rainfall. Most ofthis increase in rainfall reaching the ground must eventually reach the streamchannel network.
A vineyard uses significantly less water than a forest andso soil moisture should be higher at the end of a growing season after theconversion compared to the forest prior to clearcutting. In addition, vineyardsare often irrigated during the summer, which replaces soil moisture with waterfrom a reservoir or with ground water if the irrigation water is supplied by awell.
After a few years, a restocked clearcut’s water use beginsto approximate that of the pre-existing forest. Thus, soil moisture conditionsat the end of the dry season begin to approximate the pre-cut soil moistureconditions. Keppeler (1998) noted that increased summer flows on the South Forkof Caspar Creek lasted only 7 years. The soil moisture regime at the end of thedry season in a Timberland Conversion clearcut will not revert to the pre-cutcondition.
Normal soil processes will tend to decrease the compactionon skid trails over time in a restocked clear cut. But, in a TimberlandConversion clearcut used to grow grapes, a permanent system of roads will beleft between planting blocks. In addition, equipment is often driven down thelanes between rows of vines in a vineyard at various times during the year. Thegentle slopes and the use of cover crops will probably tend to promoteinfiltration between rows of vines but, the movement of equipment between thevines will tend to reduce infiltration. The permanent roads between vineyardblocks will increase the area subject to overland flow. It is imperative thatthe vineyard roads be properly designed to quickly drain and prevent the roadrunoff from concentrating.
The following tablesummarizes the factors that effect streamflow following a clearcut during thethree hydrologically significant periods of the year.
|
Factor Increasing Streamflow
|
Dry Season Flow
|
Early Season Storms
|
Late Season Storms
|
| Reduced Evapotranspiration
|
Yes
|
Yes
|
|
| Reduced Canopy Interception
|
|
Yes
|
Yes
|
The permanent removal of the forest canopy will increasethe amount of rainfall reaching the ground surface by about 22% due to thereduction in canopy interception. The increased rainfall will soak into thesoil and increase its moisture content. The conversion from a forest to avineyard will significantly reduce the amount of water drawn out of the soil byvegetation. These two factors will increase soil moisture levels throughout theyear and will lead to a significant increase is subsurface flow.
Increased Peak Flows and Sediment Discharge
The removal of the trees will result in higher antecedentsoil moisture levels, increase subsurface storm flow and a potential increasein percolation to deep groundwater. The increased water moving along thesubsurface storm flow pathways will eventually surface into the drainagenetwork and potentially erode the head of the channel. Jaeger (2004) offers thefollowing summary of the dynamics of channel head formation.
The channel head represents the startof the drainage network, and its location is influenced by the underlyingbedrock, soil characteristics, climate regime, and land use (Montgomery andDietrich 1988, 1989; Prosser 1996; Wemple et al. 1996). Past workers haveproposed that the processes driving channel-initiation and channel headlocations can be mathematically described through exceedence of an erosionthreshold (Dietrich et al. 1992, 1993; Montgomery and Dietrich 1994). Such anerosion threshold is specific to the particular mechanism controllingchannel-initiation (e.g. overland flow, shallow landsliding, and seepageerosion) and is expressed in terms of the contributing drainage area (Acr) and local ground surface slope (q). For example, therequired contributing area required for channel-initiation by overland flow isgiven by
Acr = C/(tanq)a (1)
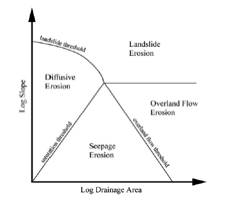 |
where C is constant as a function of rainfall intensity and site-specificphysical field characteristics (Montgomery and Foufoula-Georgiou 1993). Thesethreshold models predict systematic source area-slope relationships aspresented in Figure 1.
Figure 1. Source area-Slope Relationship. A Schematic takenfrom Montgomery and Dietrich (1994) where landscape is divided according todominant channel initiation processes.
Figure 2 (of this letter, presented after the references)shows the proposed Campbell THP/Timberland Conversion superimposed on the1:100,000 Geologic Map (Blake 2002). Thesuperimposed project location is approximate because differences in the basetopographic maps make it difficult to precisely overlay topographic map showingthe project location on the geologic map on the. The geologic map shows that,in the project is underlain by the Ohlson Ranch Formation which in turn sits ontop of the Franciscan Formation. The Franciscan Formation is much lesspermeable than the Ohlson Ranch Formation and ground water typically only flowsalong cracks in the essentially impermeable rock. Therefore, it is likely thata saturated zone develops above the Ohlson Ranch/Franciscan boundary. A smallportion of the water in the perched saturated zone may leak into fractures inthe underlying Franciscan but most of it will tend to move downslope above thecontact and increase the depth of saturation near the head of the Class IIIchannels and in zero-order basins (swales). The increased depth of saturatedsoil will increase the storm discharge into the channel network. In addition tothe increased flow along the Ohlson Ranch/Franciscan boundary, there will beincreased flow along the A-B horizon interface and increased flow along theinterface between the C horizon and the underlying Ohlson Ranch Formation. Theincreased flow along each of these three subsurface pathways will increase thedepth of saturation at the contact between the Ohlson Ranch Formation and theFranciscan.
In Appendix 2 of the NorthCoast Watershed Assessment Project (NCWAP) Report for the Gualala River Fullerand Custis (2002) discuss the characteristics of the Ohlson Ranch Formation.The following are quotes from their report:
The Franciscan Complex and the Ohlson Ranch Formation are themost important geologic units in regard to landsliding in the Gualala Riverwatershed. (p. 13)
The Pliocene Ohlson Ranch Formation caps flat to slightlyundulating ridge tops found extensively throughout the Annapolis and StewartsPoint 7.5′ quadrangles. The geologic unit consists mostly of poorlyconsolidated marine sandstone, with small exposures of conglomerate. The OhlsonRanch Formation is deeply weathered, fossiliferous, and generally soft, and thesandstones are very fine-grained. The sediments were deposited on marineterrace surfaces that later were uplifted by regional tectonic forces. Thisunit is generally less than 100 feet thick. Limited fieldwork and map relationssuggest that failures occur primarily where slopes steepened along streamchannels and at the edges of the flat-topped ridges. This relationship isfurther discussed and illustrated in the Mass Wasting History Section. Failuresoccur primarily as small discrete slumps, rotational slides, and earthflows.(p. 15)
The youngest consolidated geologic formation in thissubdivision is the Ohlson Ranch Formation. The relatively young marinesediments of this formation are poorly consolidated sands, silts and gravelsthat tend to slump or flow when saturated on slopes such as those near thecontact with the underlying Franciscan formation. (p. 20)
The Ohlson Ranch Formation is poorly consolidated weak rockthat sits atop flat-topped ridges found throughout the Annapolis Quadrangle andadjoining areas. The Ohlson Ranch Formation is stable on relatively flatslopes, but is unstable on steeper slopes generally occurring along its contactwith underlying formations and along stream channels. (p. 27)
So, the increased depth of saturation of the Ohlson RanchFormation at the contact with the Franciscan Formation, after the Campbelltimber harvest, is expected to cause slumping or earth-flows which will resultin the headward erosion of the Class III watercourses downslope of the project.
Figure 2 shows the approximate location of the OhlsonRanch/Franciscan boundary on a 7.5 minute topographic map. Figure 2 also showsthe location of the Class III streams where the increased subsurface storm flowwill be delivered to the channel network. Colluvium-filled zero-order basins(swales) may lay just upslope of the channel-head of the Class-III streams. Theincreased soil saturation in the zero-order basins has the potential toinitiate headcutting of the channel-head. Headcutting of the channel head wouldcause sediment to enter the channel network and result in a violation of ForestPractice Rules 916.9(a) (1)(2)(7) which are quoted below.
The increase soil saturation in the areas adjacent to theClass III streams at the interface between the Ohlson Ranch Formation and theunderlying Franciscan Formation is likely to result in small discrete slumps,rotational slides, and earthflows as noted by Fuller and Custis (2002) quotedabove.
Dr. Robert Curry (personal communication) reports that hehas observed the following affect of a timberland conversion for a vineyard inNapa County:
After the conversion, old barely-detectable “fossil”swales saturated and developed incipient and then real runoff with overlandflow in what would have been seen as a “zero order” healed in-filledswale. We didn’t know it was thereuntil after it eroded.
Dr. Curry’s observations verify that headward erosion ofthe channel network does occur after forest clearing for vineyards.
In addition, the increased subsurface storm flow mayincrease the saturated area around the head of the channel leading to increasedsaturated overland flow which would rapidly enter the channel network. Theincrease in saturation near the channel head may also trigger debris-flows inthe steeper channel heads such as those that drain towards Buckeye Creek andGrasshopper Creek. Debris-flows are triggered when the drainage out of a massof colluvium can not keep pace with the subsurface inflow to the colluvialmass. Typically, the drainage imbalance is triggered by intense rainfall butthe higher soil moisture induced by the increased subsurface stormflow to thechannel head may decrease the rainfall intensity needed to trigger adebris-flow.
The increased subsurface storm flow would enter thechannel network potentially increasing the storm peaks over pre-harvest levelswhich may in turn induce erosion of the channel bed and banks downstream of thechannel head.
The Caspar Creek study presents evidence from a watershednear Fort Bragg, CA that demonstrates that peak flows (storm runoff) areincreased by clearcutting. Clearcutting is a required step in the TimberlandConversion process. Therefore, it is likely that the Class III watercoursesdraining towards Little Creek will experience a significant increase in peakflows and erosion. The Caspar Creek studies found a mean peak flow increase of27% for storms with a 2-year recurrence interval on clearcut watersheds rangingfrom 25 to 67 acres.
Therefore, the expected increase in the magnitude of peakflows in the Class III watercourses near the Campbell THP/Timberland Conversionare also expected to have a significant and measurable increase in suspendedsediment load. The expected increase in sediment load will result form theerosion of the channel bed by the increased peak discharges and the failure ofthe Ohlson Ranch Formation near its interface with the Franciscan Formation.
The expected increase in peak flow magnitude in thewatercourses near the Conversion results in apparent violations of the threeForest Practice Rules listed below (emphasis added):
916.9(a)(1) Comply with the terms of a Total MaximumDaily Load (TMDL) that has been adopted to address factors that may be affectedby timber operations if a TMDL has been adopted, or not result in any measurablesediment load increase to awatercourse system orlake.
916.9(a)(2) Not result in any measurable decrease inthe stability of a watercourse channel or of a watercourse or lake bank.
916.9(a)(7) Result in no substantial increases inpeak flows or largeflood frequency.
The expected increases in peak flows will violate916.9(a)(7). The expected increase in peak flows from the timberland conversionwill measurably decrease the stability of the bed and banks of the Class III’sby initiating headcutting, in violation of Rule 916.9(a)(2). The anticipatederosion of the bed and banks of the Class III channels and possibly the Class Iwatercourses downstream in Grasshopper Creek will result in a measurableincrease in sediment load in violation of Rule 916.9(a)(1).
The expected erosion of the channel-head and the bed andbanks of the Class III watercourses downslope of the Campbell THP/TimberlandConversion, as they adjust to the expected increased magnitude of peaks flowdelivered by subsurface storm flow, may result in a direct potential adverseimpact to the steelhead habitat in Grasshopper and Buckeye Creeks downstream ofthe Conversion. The steelhead habitat in Grasshopper and Buckeye Creeks mayalso be incrementally impacted by the sediment generated from the CampbellTHP/Timberland Conversion and other harvests or conversions in the GrasshopperCreek or Buckeye Creek watersheds.
Since steelhead, a federally listed species, are known toinhabit the Grasshopper Creek, a complete analysis of the environmentalimpacts, including cumulative impacts, of the Campbell THP/TimberlandConversion require analyzing the impact of increased peak flows and theresulting increase in sediment and other harvests or conversions in theGrasshopper Creek watershed. The Forest Practice Rules quoted above requirethat the Timberland Conversion not generate and measurable sediment ormeasurable increases in peak flows and must not destabilize and channel bed orbank.
The potential adverse environmental impacts from increasedsubsurface storm flow and the resulting increases in peak flow and erosion ofthe Class III channel heads on the steelhead in Grasshopper and Buckeye Creeksinvalidates the conclusion that the THP/Timberland conversion will not have anadverse effect on the environment, even after the proposed mitigations havebeen applied. CDF should either deny the application for the CampbellTHP/Timberland Conversion or should require an EIR
Cumulative Impacts
Klein (2003) investigated the relation between the averageannual rate of harvest and turbidity in eight watersheds in North CoastalCalifornia. Turbidity and stage were collected automatically every 15-minutesfrom October through the following May, a period of eight months or 240 days.Klein notes that;
A large body of scientific literature exists on effects ofturbidity and suspended sediment on aquatic biota (see review by Henley andothers, 2000). Relatively low turbidities (above about 20-25 NTU, according tomost studies) and suspended sediment concentrations (above about 25 mg/l)reduce ‘reactive distance’ (the distance at which food can be sighted undervarying levels of water clarity) for juvenile salmonids. Even relatively lowturbidities may impair the ability of juvenile salmonids to forage for food andattain sizes needed for ocean survival (Newcombe and MacDonald, 1991; Newcombeand Jensen, 1996; Sigler and others, 1984), although a few studies suggesthigher thresholds (e.g., 150 NTU in Gregory and Northcote, 1993).
Large smolt outmigrant size has been shown to increase thechances of a fish returning as a spawning adult, so suppression of feeding andgrowth for a cohort can result in poor escapement numbers (returning spawners),even if smolt outmigration numbers are relatively high (Nicholas and Hankin,1989). A host of other effects has been identified on salmonids, includingbehavioral effects (Berg and Northcote, 1984; Barrett and others, 1992) andmortality during egg incubation (Slaney and others, 1977). In addition toeffects on juvenile fish feeding ability, turbid water diminishes the amount ofsunlight reaching the streambed, which suppresses primary production (Henleyand others, 2000).
Klein goes on to state:
Suspended sediment transport at low concentrations can occurduring small storms and between storms for some length of time after the peakhas passed. Traveling around the northcoast of California, it is easy to noticethat some streams tend to clear up much faster than others following cessationof rainfall. Differences between streams are especially apparent duringrecessional stormflows and winter baseflows; times when some streams havebecome virtually clear while others remain quite turbid. To protect and restorewater quality and beneficial uses, it is important to determine the extent towhich land management contributes to elevated fine sediment loads and thetendency for streams to experience extended periods of turbidity during thewinter.
In California, the State’s Forest Practice Rules (FPRs)attempt to minimize logging-related erosion primarily through the use ofrestrictions on harvesting and yarding methods. The rules are, in effect, ‘bestmanagement practices’ (BMPs). Although much improved relative to earlier(pre-FPR) practices, current FPRs cannot prevent all erosion and streamsedimentation from logging. Perhaps the best example of this is a recent studydone in Caspar Creek (Jackson State Forest, Mendocino County) undertaken by theUS Forest Service, Redwood Sciences Laboratory (RSL) and funded by theCalifornia Department of Forestry and Fire Protection (CDF). The study wasdesigned to compare erosion and sediment yield from a second-growth redwoodforest (the South Fork of Caspar Creek) with that from adjacent areas loggedunder contemporary FPRs (North Fork Caspar Creek) using a variety ofsivicultural and yarding methods and harvest levels.
From the Caspar Creek study, Rice (1996) found that erosionwithin logged sub-basins in the North Fork Caspar Creek (74 tonnes/ha) was, onaverage, over 10 times that occurring within the second-growth ‘control’ sub-basins (6.7 tonnes/ha), despite the use of relatively benign harvest practices(e.g., limiting tractor logging to gentle slopes, locating roads alongridgetops). He also found that erosion generally increased proportionally withthe percent of the area logged and that sediment yield was much less thanerosion over the course of the study period, owing to hillslope and channelstorage of a large proportion of eroded materials. It is likely that sedimentyield will account for an increasing proportion of erosion over time astemporarily stored material works its way downslope and downstream.
Klein explains the relationship he found between chronicturbidity and the annual rate of harvest over a fifteen year period and betweenchronic turbidity and road density.
Figures 12 and 13 show relationships between the 10%exceedence turbidity for WY2002 and annual rate of timber harvest (1988-2002)and road density, respectively. Individually, these two land managementvariables explained fair amounts of the variability in turbidity at the 10%exceedence level (as indicated by their R-squared values), and did so in alogical manner, i.e., turbidity increased as a function of both the density ofroads in a watershed and the annual rate of timber harvest.
To examine the combined effect of these two variables onturbidity, a multiple linear regression analysis was performed using WY2002data. This water year was selected over for regression analysis because: 1) inWY2000 only five of the eight turbidity stations were in operation, and 2) WY2001 was a very dry year, thus it wasless representative of normal conditions than WY2002.
Regression output is given in Appendix C. This simpletwo-variable model explained over 75% of the variability in turbidity at the10% exceedence level (adjusted R-squared = 0.752, see Appendix C). Road densityas a predictor of 10% turbidity exceedence was slightly less than significantat the 95% confidence level (P-value = 0.0478). Annual harvest rate was significantat the 95% level (P-value = 0.0607). As mentioned earlier, data acquired onroads was inconsistent in quality and completeness between the study basins,and this may explain the relatively lower level of significance for roaddensity in the regression. The predicted 10% turbidity exceedence for HorseLinto Creek had the largest standard residual, indicating larger disagreementbetween the observed and predicted values than for the other basins. Asmentioned earlier, Horse Linto Creek was heavily burned in 1999, just prior tothe data period used for this analysis. Post-fire erosional responses are alikely explanation for the larger standard residual.
Klein’s Figures 12 and 13 are reproduced in this letter asFigure 3. The 10% exceedence turbidity is the turbidity value that wassurpassed by only 10% of the measured turbidity values at a station during theeight months (240 days) of operation. In other words, the turbidity was greaterthan the 10% exceedence turbidity for a total of 24 days.
Table 1 list of all the THPs within the Watershed AssessmentArea, excluding the 90 acres proposed under the Campbell THP 1-00-147 SON. THPsthat occurred inside of the Biological Assessment Area but were outside of theWatershed Assessment Area were excluded. The THP information was taken from therevised THP page 30 marked “Received Feb 01, 2005” and from the map on page 42,marked “Received Jan 24, 2005”.
Table 1 reveals that the average annual harvest rate for theWatershed Assessment Area, for 1990-2004 (15-years), was 4.64%. Klein’s Figure12, shown in Figure 3 of this letter, estimates that the 10% exceedenceturbidity for the streams within the Watershed Assessment Area would be greaterthan 40 NTU. In other words, the turbidity is expected to exceed 40 NTU for atotal time of 24 days during the eight months from October through thefollowing May.
Klein’s multiple regression model to predict the 10%exceedence turbidity from road density and annual harvest rate is given by thefollowing formula.
10% ExceedenceTurbidity = 3.234*(Road Density) + 463.926*(Harvest Rate) + 4.996
No information about the road density in the WatershedAssessment Area was given in the THP. However, the Table-A estimates the 10%exceedence turbidity for the Campbell Watershed Assessment Area based on arange of Road Density values selected from Table 2. Table 2 shows the thresholdfor various parameters associated with four levels of habitat value. Themidpoint of the range of road density values for each level of habitat value wasused in conjunction with the measured average annual harvest rate for theCampbell Watershed Assessment Area to estimate the 10% exceedence turbidity.
Table-A. Predicted10% exceedence turbidity values for a range of road densities for the CampbellWatershed Assessment Area and the reported average annual harvest rate for theCampbell Watershed Assessment Area. Evening assuming a road density of only1-mile per square-mile results in a 10% exceedence turbidity of 29 NTU. A 10%exceedence turbidity > 25 NTU is associated with diminished vigor insalmonids. The regression coefficients are from Klein (2003).
| Habitat Value
|
Lower Level of Road Density
|
Midpoint of Road Density Range
|
Upper Level of Road Density
|
Annual Average Harvest Rate
|
Predicted 10% Exceedence Turbidity
|
| High/Excellent
|
0
|
1
|
2
|
4.64%
|
29.8
|
| High/Good
|
2
|
2.5
|
3
|
4.64%
|
34.6
|
| Low/Fair
|
3
|
4.5
|
6
|
4.64%
|
41.1
|
| Low/Poor
|
6
|
6
|
|
4.64%
|
45.9
|
|
|
|
|
|
|
|
|
|
|
|
|
|
|
| Regression Coefficients
|
|
|
|
|
|
| Road Density
|
3.234
|
|
|
|
|
| Harvest Rate
|
463.926
|
|
|
|
|
| Intercept
|
4.9965
|
|
|
|
|
The Humboldt Watersheds Independent Scientific Review Panelfound that 10% exceedence turbidity values greater than 25 NTU were detrimentalto salmonids. All of the predicted 10% exceedence turbidity for all the assumedvalues of road density used in Table-A are greater than 25 NTU.
Therefore, it is reasonable to conclude that significantcumulative effects already exist in the Watershed Assessment Area used for theCumulative Effects analysis of the Campbell THP 1-00-147 SON.
Conclusions
Several significant adverse impacts are expected to occurif the Campbell THP/Timberland Conversion 1-00-147 SON is approved andimplemented. The THP, the Erosion Control and the initial study do not discussthese potentially serious impacts. The reports use superficial and incompleteanalysis to determine that there would be no significant adverse impacts to theenvironment resulting from the Campbell Timberland conversion and associatedTHP. A careful analysis shows that a variety of significant hydrologic impactsmay arise from the Campbell Timberland conversion. These impacts include butare not limited to:
- Subsurfacestorm flow is expected to significantly increase the peak flows in the classIII watercourses that drain to Grasshopper and Buckeye Creeks.
- Subsurfacestorm flow and increased percolation to the groundwater table are expected tocause headcutting of the Class III channels. Increased peak flows are expectedto erode the bed and banks of the Class III watercourses downstream of thechannel head. The resulting additional sediment load may have an adverse impacton steelhead and their habitat in Grasshopper and Buckeye Creeks.
- Increasedsaturation of the Ohlson Ranch Formation at its contact with the underlyingFranciscan Formation is expected to result in slumping of the material intoClass III watercourses.
- Thepotential for significantly increased levels of suspended sediment in the classIII watercourses that drain into Grasshopper and Buckeye Creeks. The resultingadditional sediment load may have an adverse impact on steelhead in lowerGrasshopper and Buckeye Creeks.
Because of these potential significantly adverse impactsfrom the Campbell THP/Conversion 1-00-147 SON, CDF should deny the CampbellTHP/Conversion or require an EIR.
Sincerely,

DennisJackson
Hydrologist
References
Blake M.C.,Jr., R.W. Graymer, and R.E. Stamski, 2002 Geologic Map and Map Database ofWestern Sonoma, Northernmost Marin, and Southernmost Mendocino Counties,California, USGS MISCELLANEOUS FIELDSTUDIES MAP MF-2402.
Blake, M.C. Jr,Judith Terry Smith, Carl Wentworth and Robert H Wright, Preliminary GeologicMap of Western Sonoma County and Northwesternmost Marin County, California. USGS Open-File Report 71-0044, 1971.
Cermak, J. andJ. Kucera, 1987. Transpiration of mature stands of spruce (Picea abies (L.)Karst.) as estimated by the tree-trunk heat balance method. In Forest Hydrology and Watershed Management –Proceedings of the Vancouver Symposium, IAHS, August 1987.
Chang, Mingteh,2003. Forest Hydrology: An Introduction to Water and Forests, CRC Press, New York.
Church,Michael, Brett Eaton, 2001, Hydrological Effects of Forest Harvest in thePacific Northwest Department of Geography, The University of British Columbia, Vancouver,British Columbia, V6T 1Z2 Riparian Decision Tool; Technical Report #3, June,2001
Dunne, T. and L.B. Leopold, 1978. Water inEnvironmental Planning. W.H. Freeman andCompany.
Fuller and Custis, GualalaRiver Watershed Assessment Report. North Coast Watershed Assessment ProgramAppendix 2, Report on the Geologic and Geomorphic Characteristics of theGualala River Watershed, California, by, December 2002, California GeologicalSurvey
Humboldt Watersheds Independent Scientific ReviewPanel, Phase II Report:Independent Scientific Review Panel on Sediment Impairment and Effects onBeneficial Uses of the Elk River and Stitz, Bear, Jordan and Freshwater Creeks, prepared for the North CoastRegional Water Quality Control Board, August 12, 2003.
http://www.waterboards.ca.gov/northcoast/down/palco/Final-Phase-II-ISRP-Report.pdf
Jaeger, Kristin Channel-Initiation andSurface Water Expression in Headwater Streams of Different Lithology. A Master’s thesis University of Washington,2004
Keppeler, E.T.1998. The summer flow and water yield response to timber harvest. PSW-GTR-168,Pacific Southwest Research Station.
Keppeler, E.T.and R.R. Ziemer, 1990. Logging Effects on Streamflow: Water Yield and SummerLow Flows at Caspar Creek in Northwestern California. Water Resources Research,Vol 26, No. 7, pages 1669-1679, July 1990.
Klein, Randy.2003. “Duration of Turbidity and Suspended Sediment Transport inSalmonid-bearing Streams, North Coastal California.” Authored undercontract with the USEPA, R9 via Redwood National and State Parks.
Lower Columbia SalmonRecovery and Fish & Wildlife Subbasin Plan, Appendix E, Chapter 4Integrated Watershed Assessment, December 2004.
http://www.lcfrb.gen.wa.us/December%20Final%20%20Plans/Approved%20Recovery%20Plan/Technical%20Appendix/Appendix%20E/TA%20E%20Ch.%204%20IWA%20Methods.pdf
Montgomery,David R., William E. Dietrich, 2002, Runoff generation in a steep, soil-mantledlandscape Water Resources Research, VOL. 38, NO. 9, 1168,doi:10.1029/2001WR000822, 2002
O’ConnerEnvironmental, Assessment of Potential Hydrologic Effects, Fairfax TimberHarvest Plan and Conversion Number 1-01-171 SON, Grasshopper Creek andAnnapolis Watersheds, Sonoma County, March 15, 2002
Rantz, S.E. andT.H. Thompson, 1967. Surface-Water Hydrology of California Coastal BasinsBetween San Francisco Bay and Eel River. U.S. Geological Survey Water-SupplyPaper 1851. Prepared in cooperation with the California Department of WaterResources.
Rantz, S.E.1974. Mean Annual Precipitation in the San Francisco Bay Region, California,1931-70. Miscellaneous Field Studies Map MF-613.
Reid, L.M.,1998. Cumulative Watershed Effects: Caspar Creek and Beyond. PSW-GTR-168,Pacific Southwest Research Station.
Selby, M.J.,1993, Hillslope Materials and Processes,Oxford University Press, Oxford.
Soil SurveyStaff, Natural Resources Conservation Service, United States Department ofAgriculture. Official Soil Series Descriptions [Online WWW]. Available URL: http://soils.usda.gov/soils/technical/classification/osd/index.html
Whipkey, R. Z.,and M. J. Kirkby. c1978. Flow Within the Soil. Pages xvi, 389 p. : in M. J.Kirkby, editor. Hillslope hydrology. Wiley,, Chichester ; New York :.
Ziemer, R.R. 1997.Caspar Creek Thornthwaite potential evaporation, water years 1990-1995. U.S.Forest Service, Pacific Southwest Research Station, Redwood SciencesLaboratory, Arcata, CA. See web site:
http://www.rsl.psw.fs.fed.us/projects/water/Thornthwaite.html,
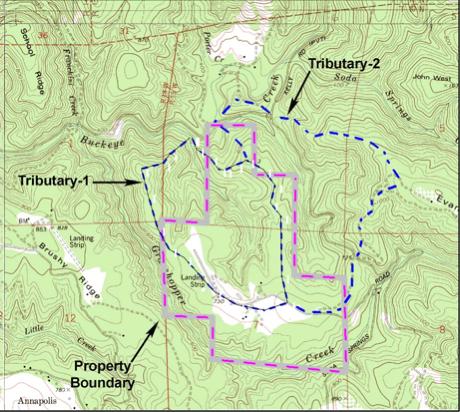 Figure 1. Topographic map showing the Campbell property and the two unnamedtributaries that drain into Buckeye Creek. The southern portion of the propertydrains to Grasshopper Creek which is a tributary of Buckeye Creek.
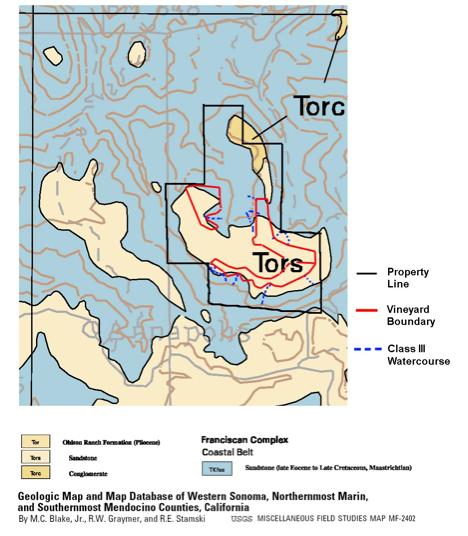 Figure 2. Geologic map of the Campbell THP/Conversion area.
Table 1. List of all the THPs within the WatershedAssessment Area. THPs that occurred inside of the Biological Assessment Areabut were outside of the Watershed Assessment Area were excluded. Informationtaken from the revised THP page 30 marked “Received Feb 01, 2005” and from themap on page 42, marked “Received Jan 24, 2005”. Note that the CampbellTHP/Conversion. 1-00-147 SON is not listed. The Campbell plan seeks to harvest90 acres.
| Plan
|
|
Acres
|
Silvicultural Method
|
Logging Method
|
|
| 90-002
|
Men.
|
|
Not Available
|
|
|
| 92-324
|
Son,
|
16
|
AP
|
Tractor
|
|
| 93-196
|
Son.
|
387
|
SIR
|
Tractor/Cable
|
|
| 93-383
|
Men.
|
322
|
SR/Sel.
|
Tractor
|
|
| 94-17
|
Son.
|
148
|
CC/SR
|
Tractor/Cable
|
|
| 95-30
|
Men.
|
258
|
SIR
|
Tractor/Cable
|
|
| 95-40
|
Men.
|
45
|
STIR
|
Tractor/Cable
|
|
| 95-49
|
Son.
|
135
|
SIR
|
Tractor/Cable
|
|
| 95-159
|
Men.
|
592
|
Sel/CT/STR/Rehab
|
Tractor/Cable
|
|
| 95-409
|
Son.
|
45
|
STIR
|
Tractor/Cable
|
|
| 96NTMP-24
|
Son.
|
285
|
AP
|
Tractor
|
|
| 96-32
|
Men.
|
146
|
AP/Rehab./STR/SSS
|
Tractor/Cable
|
|
| 96-44
|
Men.
|
63
|
Sel.
|
Tractor
|
|
| 96-346
|
Son.
|
147
|
STIR
|
Tractor
|
|
| 96-353
|
Son.
|
249
|
AP/STR
|
Tractor/Cable
|
|
| 97-34
|
Men.
|
62
|
STIR
|
Tractor/Cable
|
|
| 97-70
|
Son.
|
445
|
AP
|
Tractor
|
|
| 98-236
|
Son.
|
74
|
CC
|
Tractor/Cable
|
|
| 99-390
|
Son.
|
20
|
Sel.
|
Tractor
|
|
| 00-129
|
Son.
|
237
|
AP/STR/Rehab.
|
Tractor/Cable
|
|
| 00-328
|
Son.
|
70
|
STIR
|
Tractor
|
|
| 01-171
|
Son.
|
105
|
Conversion
|
Tractor
|
|
| 02-261
|
Son.
|
|
Withdrawn
|
|
|
| 04-59
|
Son.
|
25
|
Conversion
|
Tractor
|
|
|
|
|
|
|
|
|
|
|
|
3,876
|
Total Acres of THPs in Watershed Assessment Area
|
||
|
|
|
15
|
years of harvest
|
|
|
|
|
|
258.4
|
Average Annual Harvest in Acres
|
||
|
|
|
5,570
|
Total Acres in the Watershed Assessment Area
|
||
|
|
|
|
|
|
|
|
|
|
4.64%
|
Annual Average Harvest Rate
|
|
|
 Figure 3. Graphs of the 10% exceedence turbidity from Randy Klein’s report tothe EPA.
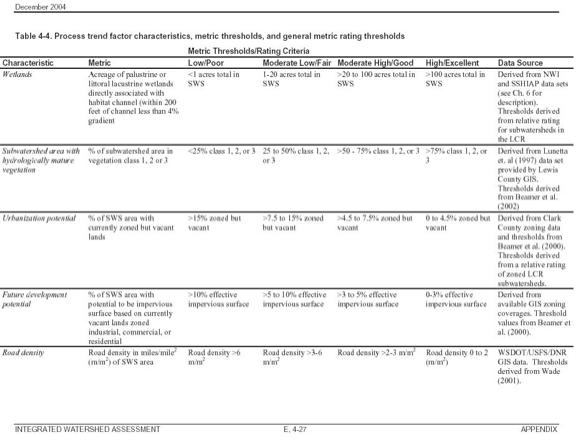 Table 2. Metric thresholds for four levels of habitat rating from the LowerColumbia Salmon Recovery and Fish & Wildlife Subbasin Plan.
GOLDRIDGE SERIES
The Goldridge series consists ofdeep and very deep, moderately well drained soils formed in material weatheredfrom weakly consolidated sandstone. Goldridge soils are on rolling uplands withslopes of 2 to 50 percent. The mean annual precipitation is 45 inches and themean annual temperature is 56 degrees F.
TAXONOMIC CLASS: Fine-loamy, mixed, superactive, isomesic Typic Haplustults
TYPICAL PEDON: Goldridge fine sandy loam–on a south facing slope of 5 percent underapple trees at 350 feet elevation. (Colors are for dry soil unless otherwisestated).
Ap–O to7 inches; light brownish gray (10YR 6/2) fine sandy loam, yellowish brown (10YR5/4) moist; single grain; soft, very friable, nonsticky and nonplastic; manyvery fine and fine roots; common very fine and fine tubular and interstitialpores; very strongly acid (pH 5.0); clear wavy boundary. (4 to 8 inches thick)
A1–7 to20 inches; light brownish gray (10YR 6/2) fine sandy loam, dark yellowish brown(10YR 4/4) moist; massive; soft, friable, nonsticky and nonplastic; many veryfine and fine, few medium and coarse roots; many fine and very fineinterstitial and tubular pores; strongly acid (pH 5.2); clear wavy boundary. (8to 15 inches thick)
A2–20 to24 inches; light brownish gray (2.5Y 6/2) fine sandy loam, yellowish brown(10YR 5/6) moist; massive; slightly hard, friable, nonsticky and nonplastic;common very fine and fine roots; many fine and very fine tubular andinterstitial pores; few thin clay films in pores; strongly acid (pH 5.1); clearwavy boundary. (2 to 5 inches thick)
Btl–24to 28 inches; light gray (10YR 7/2) fine sandy loam, yellowish brown (10YR 5/6)moist; massive; hard, firm, slightly sticky and slightly plastic; many veryfine and fine roots; many fine and very fine interstitial and tubular pores;many thin clay films in pores; very strongly acid (pH 5.0); clear wavyboundary. (3 to 5 inches thick)
Bt2–28to 41 inches; pale yellow (2.5Y 7/4) sandy clay loam with common fine distinctolive yellow (2.5Y 6/8) mottles, yellowish brown (10YR 5/6) moist with commonfine distinct brown (7.5YR 5/4) mottles; massive; very hard, firm, sticky andplastic; common fine and few medium roots; many fine and very fine tubularpores; continuous thick clay films in pores; very strongly acid (pH 4.6);gradual irregular boundary. (10 to 15 inches thick)
Bt3–41to 57 inches; mottled very pale brown and light yellowish brown (10YR 7/4, 6/4)sandy clay loam, olive yellow (2.5Y 6/6) moist with common gray (10YR 5/1)streaks; massive, very hard, firm, slightly sticky and slightly plastic; fewfine roots; common fine and very fine tubular pores; continuous thick clayfilms in pores; extremely acid (pH 4.3); diffuse wavy boundary. (13 to 18inches thick)
Bt4–57to 73 inches; very pale brown (10YR 8/4) sandy clay loam with common finedistinct brownish yellow (10YR 6/8) mottles, yellow (2.5Y 7/6) moist withcommon coarse prominent gray (10YR 5/1) mottles; massive; hard, firm, nonstickyand slightly plastic; no roots observed; common very fine and fine tubularpores; continuous thick clay films in pores; very strongly acid (pH 4.5);diffuse wavy boundary. (0 to 20 inches thick)
C1–73 to80 inches; pale yellow (2.5Y 8/4) fine sandy loam with common fine distinctyellow (2.5Y 7/6) mottles; yellow (2.5Y 7/6) moist with common medium prominentbrown (10YR 5/3) mottles; massive, hard, firm, slightly sticky and slightlyplastic; no roots observed; common fine and very fine tubular pores; continuousthick clay films in pores; very strongly acid (pH 4.5).
TYPE LOCATION: Sonoma County, California, 2 rows in from Elphic Road in the northeastcorner NW 1/4, SW1/4, Section 11, T. 6 M., R. 9 W.
RANGE IN CHARACTERISTICS: The solum is 40 to 60 inches thick. Depth to weaklyconsolidated sandstone ranges from 40 to more than 60 inches. The mean annualsoil temperature varies from 53 to 58 degrees F. The soil between the depths of8 to 24 inches is moist in all parts from November to May. It is dry in someparts the rest of the year. Reaction is strongly or very strongly acidthroughout.
The A horizon is lOYR 5/2, 5/3, 6/2, 6/3, 2.5Y 5/2, or6/2. Moist colors are lOYR 4/4, 5/4, 5/6, 6/4, 6/5, 2.5Y 5/4 or 6/4. It is finesandy loam with 10 to 20 percent clay.
The Bt horizon is lOYR 6/2, 6/4, 7/2, 7/4, 2.5Y 6/2,6/4, 7/2 or 7/4. Moist colors are lOYR 5/6, 6/6, 7/6, 8/4, 2.5Y 6/6 or 7/6. Itis sandy clay loam or clay loam with 25 to 35 percent clay. The upper part ofthe Bt horizon is fine sandy loam in some pedons. Base saturation is 20 to 35percent.
The C horizon is lOYR 7/2, 7/4, 814, 2.4Y 7/2, 7/4, or8/4. Moist colors are 2.5Y 7/6 or 7/4. It is sandy clay loam or fine sandy loamwith 15 to 25 percent clay. Base saturation is 20 to 30 percent.
COMPETING SERIES: These are the Cotati and Sebastopolseries in other families. Cotati soils have thermic soil temperatures.Sebastopol soils are clayey and have a xeric soil moisture regime.
GEOGRAPHIC SETTING: The Goldridge soils occur on rolling uplands. Slopesare 2 to 50 percent. Elevations range from 200 to 2,000 feet. The climate issubhumid mesothermal with warm dry summers and cool moist winters. Mean annualprecipitation varies from 35 to 60 inches. Mean annual air temperature is 56degrees F, mean January temperature is 45 degrees F, and mean July temperatureis 70 degrees F. The frost-free season is 225 to 240 days.
GEOGRAPHICALLY ASSOCIATED SOILS: These are the competing Cotati and Sebastopolsoils and the Steinbecksoils. Steinbeck soils have base saturation of 35 to 50 percent in the Bthorizon.
DRAINAGE AND PERMEABILITY: Moderately well drained; medium runoff; moderatelyslow permeability.
USE AND VEGETATION: Used mostly for apple orchards and timber. Nativevegetation consists of redwood, Douglas fir, madrone and tanoak.
DISTRIBUTION AND EXTENT: Northern Coastal California. The series is moderatelyextensive.
MLRA OFFICE RESPONSIBLE: Davis, California
SERIES ESTABLISHED: Sonoma County, California, 1915.
REMARKS:This is a classification change from fine-loamy, mixed, mesic Typic Haplustultsto fine-loamy, mixed, isomesic Typic Haplustults. Change is based onsoil-moisture temperature data gathered in adjoining soil survey areas.
The activity class was added to the classification inFebruary of 2003. Competing series were not checked at that time. – ET
This pedon was sampled by the SCS Riverside SoilSurvey Laboratory in 1961. Pedon number is S61 Calif 49-6 and is described inthe California SSIR No. 24 Pages 588 and 589.
Diagnostic horizons and features are as follows:
1. Ochric epipedon – O to 24 inches (Ap, Al, A2);ranges from 14 to 28 inches thick. Clay content by Riverside Lab is 9.5 in Ap,12.2 in Al, and 12.5 in A2. Organic matter is 1.48 in Ap, 5.2 in Al anddecreases with depth–by Riverside Lab. B.S. is 33 to 38 percent by RiversideLab.
2. Argillic horizon – 28 to 73 inches (Bt2, Bt3, Bt4);ranges from 23 to 53 inches thick. B.S. ranges from 22 to 32 percent byRiverside Lab. The textural control section is 28 to 48 inches, or the top 20inches of the argilllic horizon. Clay content by Riverside Lab was 33.4 percentin the Bt2 28.9 percent in the Bt3, and 21.6 percent in the Bt4.
3. Mixed mineralogy–U.C. Davis data.
4. Soil temperature 53 to 58 degrees F–based on soilclimate transect in Marin and Mendocino Counties on similar soils under similarvegetation.
5. Soil moisture in moisture control section.
J F M A M J J A S O N D
Dry in all parts 7/15-9/15
Moist in all parts 1/1—5/1
Soil is moist in all parts for 214 days and moist in some parts for 300 days.
OSEDscanned by SSQA. Last revised by state on 3/87.
National Cooperative Soil Survey
U.S.A.